Economic Growth Effects of Agricultural, Manufacturing and Crude Oil Exports in Nigeria
-
Edamisan Stephen Ikuemonisan

Department of Agricultural Economics, Faculty of Agriculture, Adekunle Ajasin University, PMB 001, Akungba Akoko, Nigeria
Emmauel KolawoleDepartment of Agricultural Economics, Faculty of Agriculture, Adekunle Ajasin University, PMB 001, Akungba Akoko, Nigeria
Adeyose Emmanuel AkinbolaDepartment of Agricultural Economics, Faculty of Agriculture, Adekunle Ajasin University, PMB 001, Akungba Akoko, Nigeria
| Received 07 Oct, 2023 |
Accepted 15 Feb, 2024 |
Published 31 Mar, 2024 |
Background and Objective: This research delves into an examination of how Nigeria's non-export Gross Domestic Product (GDP) has been influenced by the export activities in the agricultural, manufacturing and oil sectors during the timeframe spanning from 1962 to 2019. Given Nigeria's reliance on oil as a driving force for its economy, the primary goal is to analyse the enduring and immediate consequences of these export sectors on both non-export GDP and real GDP. Materials and Methods: Extensive data spanning from 1962 to 2019 were collected and analyzed. The study employs statistical techniques to assess the significance and direction of the impacts of agricultural, manufacturing and oil exports on economic indicators. The analysis also considers the correction of deviations from long-run equilibrium in the current period. Results: In the long run, the study finds that agricultural exports and exchange rates have statistically significant and positive impacts on the non-export GDP. In contrast, manufacturing exports exhibit a negative influence on both the non-export GDP and real GDP. Notably, oil exports are statistically significant, negatively affecting real GDP but having no significant impact on the non-export GDP. Additionally, the study reveals that previous period deviations from long-run equilibrium are corrected at an adjustable speed of 4%. Conclusion: In the short run, the research demonstrates that a unit change in agricultural and manufacturing exports leads to a 0.02% decline and a 0.03% increase in economic growth, respectively. These findings underscore the importance of value addition in agricultural exports to enhance competitiveness and maximize returns.
| Copyright © 2024 Ikuemonisan et al. This is an open-access article distributed under the Creative Commons Attribution License, which permits unrestricted use, distribution, and reproduction in any medium, provided the original work is properly cited. |
INTRODUCTION
The intricate dynamics of export-driven economic growth have sparked extensive debate in academic circles. Acknowledging the consensus that exports can fuel economic growth and generate job opportunities, there is increasing interest in the specific outcomes of such strategies in developing economies, with a particular emphasis on sub-Saharan Africa1,2. The academic discourse on exports has yielded conflicting findings, leading to arguments both in favor of and against an export-driven economy3-5. Advocates highlight its potential for increased productivity, economic growth and employment opportunities. However, critics, especially in sub-Saharan African countries where primary/raw resource exports dominate, argue that this approach limits regional economic growth and triggers adverse effects like the "Dutch disease," negatively impacting overall welfare6,7.
Nigeria serves as a compelling case study, having undergone a significant economic shift after the discovery of oil in 19658. This shift towards oil revenue came at the expense of neglecting the traditionally robust agricultural sector. Scholars hold varying opinions on the contributions of oil and agricultural exports to sub-Saharan Africa's economic growth. Despite the ongoing debate against excessive primary production exports, there is recognition in the literature of potential benefits, such as rapid economic growth, income level multipliers and increased job opportunities, especially for the youth9,10. However, Nigeria grapples with pronounced poverty, attributed to issues like inefficient income distribution and ineffective trading systems.
Motivated by the need to evaluate the performance of investments in Nigeria's agricultural and manufacturing sectors, the study aims to provide valuable insights for government policies geared towards diversifying the economy. Despite substantial investments in non-oil sectors, the oil sector remains integral to financial development and economic progress11,12.
The literature extensively explores the relationship between the agriculture and manufacturing sectors and economic growth13,14. Recent data indicates a significant rise in agricultural exports, hinting at the potential for growth in this sector15. However, persistent challenges, including low productivity, compromised quality and production hurdles, hinder the full realization of the agricultural and manufacturing sectors' potential.
The study’s significance lies in its focus on assessing the relationship between economic growth and major export sectors in Nigeria. It is structured into 5 sections, encompassing a comprehensive literature review, details on data sources and methodologies, results and discussions and a conclusive summary. Scholarly interest in African economies, exemplified by Oqubay16, underscores the importance of understanding varied outcomes despite similar strategies, considering market and political economy factors. The recent shift towards export-driven economies in sub-Saharan Africa to achieve economic growth gains momentum. However, challenges, such as the focus on exporting primary and natural resources instead of manufactured goods, have led to deteriorating terms of trade3,17.
The literature review incorporates diverse studies examining the relationship between exports and economic growth. Various researchers explored the impact of oil revenue and corruption index on economic growth in Nigeria, while others studied the positive relationship between Nigeria’s agricultural exports and economic growth. Conflicting findings regarding the impact of agricultural exports on economic growth in South Africa and the negative relationship between oil exports and economic growth in Nigeria, Iran and Iraq are discussed.
Noteworthy is the study’s acknowledgment of the limitations of previous research methodologies, emphasizing the necessity for time-series data in examining causal relationships. It underscores the importance of considering country-level peculiarities and advocates for robust methods such as the Johansen Co-integration test and vector error correction model1,18,19. The study endeavors to provide valuable insights into the economic growth effects of agricultural, manufacturing and crude oil exports in Nigeria. By shedding light on the complex relationships among these sectors, this study aims to inform policymakers and contribute to the ongoing discourse on economic diversification.
MATERIALS AND METHODS
Data and data sources: In this study, secondary data were employed to investigate the relationship between economic growth and agricultural exports and manufacturing exports in the period, 1962-2019.
The source of the data is the website of World Development Indicators (WDI) and data on the following variables were obtained: Real Gross Domestic Product (GDP measured in USD), Real Gross Domestic Product less exports (non-export GDP measured in USD), total value of exports good and services, manufacturing exports (Manu), agricultural exports (Agric measured in USD), exchange rate (Naira/USD = EXR) and fuel exports (oil measured in USD). The missing data were filled by taking the average of five data points before and after the missing values.
Model specification: This study adapted the vent surplus approach to trade and development proposed by Adam Smith and recently used by Ijirshar20 and Osabohien et al.1. The vent surplus theory asserts that international trade allows for the full use of economic resources. In other words, exports should positively enhance value added per capita and consequently improve the non-export GDP (household consumption, government expenditure and investment). On the other hand, the hypothesis suggests that, as the economy of a country grows, the nearness of surplus assets without corresponding utilization of resources can cause a leftward shift of the production possibility frontier and consequently lower productivity20,21. In clear terms, the vent surplus theory promotes sectoral effectiveness with the goal that the resultant yield surpasses the underlying contributions in view of surplus generation. Consequently, the model is specified as:
| (1) |
Where, GDP represents real gross domestic product/non-export gross domestic product as a proxy for economic growth as used in the study of Osabohien et al.1. The β0 is the intercept; slope of X, whereas, X represents the endogenous factors determined in the model and is the error term capturing the other logical variables not included in the model. The implicit and explicit equations of Eq. 1 are stated in Eq. 2 and 3, respectively:
GDP = f (Agric, manu, oil, EXR) |
(2) |
InGDP = β0+ β1InAgric+ β2Manu+β3oil+β4EXR+e |
(3) |
In (non-export GDP) = β0+ β1InAgric+β2Manu+β3oil+β4EXR+e |
(4) |
Where, in represent natural log, GDP: Real gross domestic product as proxy for economic growth, real non-export GDP as used in the study of Zayone et al.2. Agric: Agricultural exports, Manu: Manufacturing exports, Oil: Crude oil exports and EXR represents exchange rate.
Unit root test: First, univariate time-series properties were examined using the augmented Dickey and Fuller (ADF) test22. The ADF procedure tests of the null hypothesis of non-stationary. Only until the data series are stationary after first differencing, they can be tested for co-integration among the selected variables. The general equation is presented as follows:
| (5) |
Where, Xt is the vector of the main endogenous variables in the study of exchange rate, agriculture, manufacturing, crude oil exports and economic growth. The unit root test assumes that the accuracy of α parameter is identical across the passage (i.e. α = β for all I), whereas the order of lag α can freely vary. This procedure tests the null hypothesis α = 0 for all I against the alternative hypothesis α.
Johansen cointegration test: The model used to determine the long-run and short-run effects if there is a co-integrating vector and begins with the johansen maximum likelihood co-integration test is employed to assess long-term associations between the variables under scrutiny23. It is crucial to make a careful selection of the appropriate lag length to ensure the reliability of the test results. The Johansen Co-integration framework is based on the Vector Error Correction Model (VECM) and it is expressed as follows in the equation:
xt = A1xt-p+...+Apxt-p+Byt+εt |
(6) |
In this context, xt stands for a set of endogenous variables and A symbolizes the matrices related to autoregressive processes. Similarly, yt denotes a vector with deterministic elements and B signifies the matrices that describe the associated parameters. The εt represents a collection of new developments or innovations, while p corresponds to the number of time lags. Interpreting the Johansen co-integration test requires a lot of caution. The positive signs are interpreted as negative and vice versa to the dependent variable. The assumption is that the signs of the independent variable reversed in the long run24.
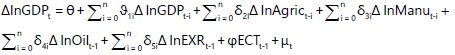
Vector Error Correction Model (VECM): The VECM model comes into play when it has been established that, there exists a long-run relationship between the variables under consideration. This enhances the opportunity to evaluate the co-integrated series. If the series are co-integrated, the VECM regression equation is an appropriate technique suitable to determine the long-run and the short-run relationships24-26 as presented as follows:
 |
(7) |
 |
(8) |
Where, all the variables are as defined in Eq. 4, ECT (t-1) represents the lagged error correction term, whose coefficient φ shows the speed of adjustment for variables to return to long-run equilibrium after a shock. The estimated coefficients of agricultural, manufacturing and oil exports can be interpreted as elasticity since all variables in the model are in natural logarithm form. Positive and statistically significant coefficients of the export variables in the short run satisfy the export-led growth hypothesis. The Statistical Package deployed for these analyses was EViews14.
RESULTS AND DISCUSSION
Econometric techniques: The summary statistics of the variables selected as shown in Table 1. It briefly describes the basic statistics of each of the selected series.
| Table 1: | Summary of descriptive statistics of the selected variables | |||
| Parameter | Real GDP US $ |
Agric US$ |
Manu US $ |
Oil US $ |
EXR |
Non-export real GDP |
| Mean | 2.00E+11 |
4.30E+08 |
8.90E+08 |
2.50E+10 |
6.40E+01 |
1.70E+11 |
| Standard error | 1.60E+10 |
1.90E+08 |
2.30E+08 |
3.60E+09 |
1.20E+01 |
1.31E+10 |
| Median | 1.40E+11 |
6.30E+07 |
8.10E+07 |
1.40E+10 |
9.00E+00 |
1.33E+11 |
| Standard deviation | 1.20E+11 |
1.40E+09 |
1.70E+09 |
2.70E+10 |
8.80E+01 |
9.94E+10 |
| Sample variance | 1.60E+22 |
2.00E+18 |
3.00E+18 |
7.40E+20 |
7.70E+03 |
9.88E+21 |
| Minimum | 6.10E+10 |
1.10E+06 |
1.30E+06 |
4.90E+07 |
5.50E-01 |
6.10E+10 |
| Maximum | 4.80E+11 |
8.00E+09 |
7.20E+09 |
1.00E+11 |
3.10E+02 |
4.16E+11 |
| Sample size | 59 |
59 |
59 |
59 |
59 |
59 |
| Author’s Computation, 2021 | ||||||
| Table 2: | Output of the unit root test | |||
| Variables | GDP |
Non-export GDP |
Agric |
EXR |
Manu |
Oil |
|
| Level | Critical value (5%) | -2.9177 |
-2.9411 |
-2.9166 |
-2.9135 |
-2.9135 |
-2.9135 |
| t-statistic | -0.1995 |
0.7904 |
-2.8309 |
0.2688 |
-1.0251 |
-2.9097 |
|
| Problem | 0.9318 |
0.9926 |
0.0607 |
0.9746 |
0.7385 |
0.0504 |
|
| First difference | Critical value (5%) | -2.9177 |
-2.9434 |
-2.9145 |
-2.9145 |
-2.9145 |
-2.9145 |
| t-statistic | -3.7675 |
-5.1515 |
-9.7905 |
-5.9049 |
-8.9397 |
-7.6263 |
|
| Problem | 0.0056 |
0.0001 |
0 |
0 |
0 |
0 |
|
| Author’s Computation, 2021 | |||||||
| Table 3: | Output of lag order selection criteria | |||
Lag order selection criteria for the Eq. 3 (Non-export GDP, Agric, Man, EXR and Oil) |
|||
| Lag | AIC |
SC |
HQ |
| 0 | 11.21377 |
11.4337 |
11.29053 |
| 1 | 3.285046* |
4.604645* |
3.745621* |
| 2 | 3.593778 |
6.013043 |
4.438166 |
| 3 | 3.748736 |
7.267667 |
4.976937 |
Order selection criteria for the Eq. 4 (GDP, Agric, Manu, EXR and Oil) |
|||
| 0 | 10.96038 |
11.18031 |
11.03714 |
| 1 | 2.653151* |
3.972750* |
3.113726* |
| 2 | 2.803222 |
5.222487 |
3.647611 |
| 3 | 2.784641 |
6.303572 |
4.012842 |
| Author’s Computation, 2021 and *denotes rejection of the hypothesis at the 0.05 level | |||
| Table 4: | Output of unrestricted cointegration rank test (trace and maximum eigenvalue) | |||
Trace |
Max-eigen statistic |
Trace |
Max-eigen |
||||||
| Hypothesized No. of CE (s) |
Trace statistic |
Problem** |
Trace Max-eigen |
Problem** |
Hypothesized No. of CE (s) |
Trace statistic |
Problem** |
Max-eigen statistic |
Problem** |
| None* | 77.4326 |
0.0109 |
42.052 |
0.0043 |
None* |
77.04524 |
0.0118 |
41.8829 |
0.0045 |
| At most 1 | 35.3806 |
0.4281 |
17.1361 |
0.5683 |
At most 1* |
35.16228 |
0.4395 |
19.2237 |
0.3974 |
| At most 2 | 18.2444 |
0.5481 |
12.0317 |
0.5445 |
At most 2* |
15.9385 |
0.7166 |
10.4978 |
0.697 |
| At most 3 | 6.21279 |
0.6704 |
5.3636 |
0.6954 |
At most 3 |
5.440685 |
0.7604 |
4.99818 |
0.7421 |
| At most 4 | 0.84919 |
0.3568 |
0.8492 |
0.3568 |
At most 4* |
0.442502 |
0.5059 |
0.4425 |
0.5059 |
| Author’s computation, 2021 and *denotes rejection of the hypothesis at the 0.05 level | |||||||||
Unit root test: Table 2 presents the output of the unit root test for the selected variables. Stationary is a property of time series variables, essentially required in a regression to avoid spurious decisions27. Thus, a time series variable is considered a stationary series when its mean, variance and autocorrelation are stationary. Because of its importance as a pre-condition for estimation in this study, the augmented Dickey-Fuller unit root test was conducted to determine if the variables were stationary27. As revealed by the Table 2, the variables were non-stationary at a level. However, all the selected variables (such as GDP, Non-export GDP, exchange rate, agricultural, oil and manufacturing exports) are stationary after taking their first difference. That is the application (1). Therefore, a vital condition is met for the co-integration test among the selected variables.
Lag structure: The appropriate lag structure is also a pre-condition for a co-integration test to avoid spurious conclusions. Therefore, the lag selection criteria for Eq. 3 and 4 are shown in Table 3 below. The number of lags was selected using the AIC criterion. Thus, for Eq. 3-4, lag 1 was the maximum lag interval selected for each.
Cointegration test: The output of the unrestricted co-integration rank test is contained in Table 4. Having established the unit root properties of the variables, a co-integration test became essential to assess the features of a long-run relationship among the selected variables to ensure that the variable’s relapse is significant in a non-deceptive form. According to the Table, the Trace test for both Eq. 3 and 4 indicates 1 co-integrating equation at the 0.05 level. Similarly, the Maximum-eigen value test indicates 1 co-integrating equation at the 0.05 level for each of the models under investigation. Evidence from both Trace and Maximum-Eigen statistics showed that a long-run relationship is co-integrated among the variables. By implication, such a presentation is an indication that the variables have a long-term connection.
| Table 5: | Output of normalized co integrating coefficients | |||
| Non-export GDP | Agriculture |
Manufacturing |
Oil |
EXR |
| Coefficient | -0.509422 |
1.030776 |
-0.109733 |
-1.041047 |
| Standard error | 0.09006 |
0.13689 |
0.25656 |
0.1365 |
| T-statistics | -5.65647 |
7.5299876 |
-0.427709 |
-7.62672 |
| Real GDP | Agriculture |
Manufacturing |
Oil |
EXR |
| Coefficient | -0.441307 |
0.982642 |
-0.351261 |
-0.942825 |
| Standard error | 0.08297 |
0.12715 |
0.13768 |
0.12871 |
| T-statistics | -5.32328 |
7.7248428 |
-2.551569 |
-7.32323 |
| Author’s Computation, 2021 | ||||
Johansen normalized co-integrating coefficient: The normalized cointegrating coefficient is contained in Table 5. The presence of statistically significant co-integration between variables suggests a long-term relationship among the variables under consideration. The result showed that non-export GDP impacts of exchange rate, agricultural and manufacturing exports were statistically significant at 5%. Expectedly, the results also showed that all the predictors considered in this study (agricultural, manufacturing exports, oil and exchange rate) have a long-run relationship with real GDP growth (at 5% statistically significant level). Although the impact of each agricultural export, oil export and exchange rate on real GDP was positive in the long run, that of the manufacturing export was negative. The results aligned with the findings in the literature1,28.
Vector Error Correction Model (VECM): Table 6 reveals the output of the Vector Error Correction Model (ECM) for the short-run dynamics of the two equations. As shown in Table 5, the presence of co-integration between variables suggests a long-term relationship among the variables under consideration. The nature of the relationships was further investigated via the analyses of estimated parameters from the ECMs. The systems of equations are filled in with the long-run model for accommodating short-run disequilibrium behavior of the selected economic variables. Subsequently, the VEC model was applied and the VECM result showed that all the explanatory variables’ relationships are as shown in Table 6.
In line with the prior expectation, that is, the vector error correction term in each of the models should have a negative sign within a 5% statistically significant level. The error correction terms within both equations, as presented in Table 6, exhibit the anticipated signs, are statistically significant and indicate a gradual adjustment toward equilibrium. The outcomes from these two equations reveal that the independent variables explain roughly 41% (in Eq. 3) and 50% (in Eq. 4) of the fluctuations in Nigeria’s economic growth as revealed in Appendix I and Appendix II. Taking into consideration the degree of freedom, the adjusted R-squared shows that 29% (Eq. 3) and 40% (Eq. 4) of each of the dependent variables is explained by the explanatory variables accordingly. These results are explicitly shown in Appendix I and II, respectively.
Interpreting the short-run dynamics of Eq. 3 as shown in Table 6, the previous period (year) deviations from the long-run equilibrium are corrected in the current period at an adjustment speed of 4%. Similarly, in the short run, a unit change in the lagged agricultural exports brought about 0.02% decline in the non-export GDP. In other words, a unit increase in agricultural exports led to a reduction in non-export GDP by 0.02%. However, for Eq. 4, a unit increase in each manufacturing export increased non-export GDP by 0.04%. Similarly, for Eq. 4, the previous period (year) deviations from the long-run equilibrium are corrected in the current period at an adjustment speed of 3% (Appendix II). In the same vein, a percentage change in agricultural exports, oil exports and exchange rate lowers the GDP in the short run by 0.01, 0.003 and 0.01% accordingly, all things being equal.
| Table 6: | Output of the estimates from Vector Error Correction Model (VECM) | |||
| Error correction | CointEq1 |
D (Non-export GDP (-1)) |
D (Agric (-1)) |
D (Manu (-1)) |
D (Oil (-1)) |
D (EXR (-1)) |
C |
R-squared |
Adj. R-squared |
AIC |
SIC |
| Non-export GDP | -0.0404 |
0.1378 |
-0.0234 |
0.0318 |
0.0128 |
-0.0409 |
0.0343 |
0.412 |
0.2944 |
-3.719 |
-3.415 |
0.012 |
0.174 |
0.0079 |
0.012 |
0.037 |
0.032 |
0.012 |
0.412 |
0.2944 |
-3.7 |
-3.415 |
|
[-3.2344] |
[0.7919] |
[-2.9551] |
[2.5339] |
[0.337] |
[-1.2634] |
[2.7428] |
0 |
0 |
0 |
0 |
|
| Error correction | CointEq1 |
D (GDP (-1)) |
D (Agric (-1)) |
D (Manu (-1)) |
D (Oil (-1)) |
D (EXR (-1)) |
C |
R-squared |
Adj. R-squared |
AIC |
SIC |
| D(GDP) | -0.0313 |
0.4303 |
-0.0096 |
0.0116 |
-0.0028 |
-0.0052 |
0.0219 |
0.4993 |
0.399 |
-3.719 |
-3.415 |
0.009 |
0.1441 |
0.0052 |
0.0081 |
0.021 |
0.0215 |
0.01 |
0.4993 |
0.399 |
-3.7 |
-3.415 |
|
[-3.4355] |
[2.9843] |
[-1.8543] |
[1.4309] |
[-0.132] |
[-0.2408] |
[2.5617] |
0 |
0 |
0 |
0 |
|
| Author’s Computation, 2021, Standard error and [] t-statistics | |||||||||||
| Appendix I: | Full detail of the estimates from Vector Error Correction Model (VECM)-Eqn 3 | |||
| Error correction: | D (Gdp_Less_Exp) | D (Agric) |
D (Man) |
D (Oil) |
D (EXR) |
| CointEq1 | -0.040352 | -0.125992 |
-1.166398 |
-0.056564 |
0.122064 |
| -0.01248 | -0.35273 |
-0.19525 |
-0.069 |
-0.06979 |
|
| [-3.23446] | [-0.35719] |
[-5.97380] |
[-0.81980] |
[1.74892] |
|
| D (GDP_Less_Exports (-1)) | 0.137795 | -0.476684 |
-0.591474 |
0.270788 |
0.389906 |
| -0.174 | -4.91955 |
-2.72318 |
-0.96231 |
-0.97341 |
|
| [0.79193] | [-0.09690] |
[-0.21720] |
[0.28139] |
[0.40056] |
|
| D (Agriculture (-1)) | -0.023393 | -0.29578 |
-0.35178 |
0.081706 |
0.039717 |
| -0.00792 | -0.22382 |
-0.12389 |
-0.04378 |
-0.04429 |
|
| [-2.95511] | [-1.32149] |
[-2.83934] |
[1.86622] |
[0.89683] |
|
| D (Manufacturing (-1)) | 0.031775 | -0.047192 |
0.457724 |
-0.071123 |
-0.067431 |
| -0.01254 | -0.35454 |
-0.19626 |
-0.06935 |
-0.07015 |
|
| [2.53394] | [-0.13311] |
[2.33229] |
[-1.02553] |
[-0.96121] |
|
| D (Oil (-1)) | 0.012758 | -0.069076 |
-1.300198 |
0.056184 |
-0.176151 |
| -0.03781 | -1.06914 |
-0.59182 |
-0.20913 |
-0.21155 |
|
| [0.33740] | [-0.06461] |
[-2.19696] |
[0.26865] |
[-0.83268] |
|
| D (EXR (-1)) | -0.040902 | -0.786781 |
-0.611649 |
0.323692 |
0.200246 |
| -0.03237 | -0.91531 |
-0.50667 |
-0.17904 |
-0.18111 |
|
| [-1.26346] | [-0.85958] |
[-1.20721] |
[1.80790] |
[1.10566] |
|
| C | 0.03426 | 0.210771 |
0.272156 |
-0.02212 |
0.130958 |
| -0.01249 | -0.35317 |
-0.19549 |
-0.06908 |
-0.06988 |
|
| [2.74282] | [0.59680] |
[1.39216] |
[-0.32017] |
[1.87406] |
|
| R-squared | 0.41204 | 0.114454 |
0.573915 |
0.36183 |
0.216146 |
| Adj. R-squared | 0.294448 | -0.062655 |
0.488698 |
0.234197 |
0.059375 |
| Akaike AIC | -3.719968 | 3.732632 |
2.55894 |
0.466382 |
0.493744 |
| Schwarz SC | -3.4152 | 4.0374 |
2.863709 |
0.77115 |
0.798512 |
| Author’s Computation, 2021 | |||||
| Appendix II: | Full detail of the estimates from Vector Error Correction Model (VECM)-Eqn 4 | |||
| Error correction: | D (Gdp_Less_Exp) | D (Agric) |
D (Man) |
D (Oil) |
D (EXR) |
| CointEq1 | -0.03131 | -0.102951 |
-1.227166 |
-0.037036 |
0.132685 |
| -0.00911 | -0.37847 |
-0.21046 |
-0.07392 |
-0.07494 |
|
| [-3.43550] | [-0.27201] |
[-5.83083] |
[-0.50101] |
[1.77052] |
|
| D (GDP (-1)) | 0.430261 | 3.701022 |
2.173904 |
1.121466 |
1.035461 |
| -0.14417 | -5.98687 |
-3.32917 |
-1.16935 |
-1.18545 |
|
| [2.98431] | [0.61819] |
[0.65299] |
[0.95905] |
[0.87347] |
|
| D (Agriculture (-1)) | -0.009639 | -0.302446 |
-0.31999 |
0.084279 |
0.030456 |
| -0.0052 | -0.21586 |
-0.12004 |
-0.04216 |
-0.04274 |
|
| [-1.85431] | [-1.40111] |
[-2.66578] |
[1.99894] |
[0.71255] |
|
| D (Manufacturing (-1)) | 0.011657 | -0.131112 |
0.40768 |
-0.092259 |
-0.07503 |
| -0.00815 | -0.33826 |
-0.1881 |
-0.06607 |
-0.06698 |
|
| [1.43096] | [-0.38760] |
[2.16735] |
[-1.39641] |
[-1.12025] |
|
| D (Oil (-1)) | -0.002816 | -0.068983 |
-1.258533 |
0.022152 |
-0.239554 |
| -0.0213 | -0.88447 |
-0.49184 |
-0.17275 |
-0.17513 |
|
| [-0.13220] | [-0.07799] |
[-2.55884] |
[0.12823] |
[-1.36784] |
|
| D (EXR (-1)) | -0.00518 | -0.650526 |
-0.481868 |
0.359403 |
0.207408 |
| -0.0215 | -0.89295 |
-0.49655 |
-0.17441 |
-0.17681 |
|
| [-0.24089] | [-0.72852] |
[-0.97043] |
[2.06069] |
[1.17305] |
|
| C | 0.021991 | 0.054658 |
0.158779 |
-0.053755 |
0.110919 |
| -0.00858 | -0.35646 |
-0.19822 |
-0.06962 |
-0.07058 |
|
| [2.56177] | [0.15333] |
[0.80102] |
[-0.77208] |
[1.57147] |
|
| R-squared | 0.499783 | 0.126186 |
0.575698 |
0.372156 |
0.225409 |
| Adj. R-squared | 0.39974 | -0.048576 |
0.490838 |
0.246587 |
0.070491 |
| Akaike AIC | -3.719968 | 3.732632 |
2.55894 |
0.466382 |
0.493744 |
| Schwarz SC | -3.4152 | 4.0374 |
2.863709 |
0.77115 |
0.798512 |
| Author’s Computation, 2021 | |||||
Also, a percentage increase in the exchange rate increases GDP by 0.01%. However, only the lagged agricultural export is statistically significant at 5%, but surprisingly, it was negatively signed, which implies that in the short run, agricultural exports negatively impact the real GDP. The findings in this study did not align with that of Osabohien et al.1, Aregbeyen and Kolawole29 and Odularu30.
Diagnostics: The VEC model estimated for these two equations is tested for serial correlation, normal distribution, heteroscedasticity and the residuals were found to be in stable conditions.
DISCUSSION
Nigeria’s crude oil exports amounted to N2.42 trn, non-crude oil exports N561.18 bn and non-oil exports N214.65 bn. Evidence from NBS reports has shown that Nigeria’s earnings from agricultural exports declined from $730 m in 2015 to ($550.9 m) in 2017. The current contributions of the agricultural sector to GDP hang around 22% but between 1961 (just immediately after independence) and 2010 (just before GDP rebasing), the agricultural sector contributed about 32-35% to GDP growth between 1970 and 20102. Whereas, in the 1960s, agricultural exports accounted for close to 75% of total annual exports but declined to less than 5% in 2020. Similarly, the manufacturing, building and construction sub-sectors account for about 5% of foreign exchange and government revenue in the same period28 (National Bureau of Statistics [NBS]). In this, revenues from oil and natural gas exports make up about 70% of total exports. Despite the important roles of agriculture, manufacturing and oil sub-sectors to Nigeria’s economic growth31-34, the above statistics reveal that Nigeria’s export revenue base is weak and is still heavily reliant on oil export revenue as its main source of foreign exchange earnings. It is in view of these, that scholars have continually explored the relationship and impact of these variables (economic drivers) on economic growth.
In this study, the stationary properties of the selected variables were similar to the findings in other studies1,35. The results of the Johansen normalized co-integration to examine long-run contributions of the selected variables on economic growth in Eq. 3 and 4 as shown in Table 5 reveal that all the independent variables (exchange rate, agricultural and manufacturing exports) except oil exports significantly influenced both the non-export GDP and real GDP at 1% significant level. However, while exchange rate and agricultural exports had a positive influence on the non-export GDP, manufacturing exports had a negative but statistically significant impact on the non-export GDP. In the long run analysis of the effects of the independent variables on the real GDP, agricultural and oil exports had a positive and statistically significant impact on the real GDP at a 5% level on average, ceteris paribus. Similarly, manufacturing exports and the exchange rate had a negative but statistically significant influence on real GDP at a 5% level, on average, ceteris paribus. The interpretation of the sign follows the theoretical assumption that the signs change in the long run12,24. The findings aligned with the findings of the previous similar studies2,33.
However, in the short-run dynamics, as shown in Table 6, the previous period (year) deviations from the long-run equilibrium are corrected in the current period at an adjustment speed of 4%. Similarly, in the short run, a unit change in agricultural exports and exchange rate brings about 0.02 and 0.04% decline in the non-export GDP. However, a unit increase in each of manufacturing and oil exports increased on-export economic growth by 0.03 and 0.01% on average, ceteris paribus. Although the impacts of exchange rate and oil exports were not statistically significant at 5%, agricultural and manufacturing exports had statistically significant impacts. The study also found that showed that the previous period (year) deviations from the long-run equilibrium are corrected in the current period at an adjustment speed of 3%. In the same vein, a percentage change in agricultural exports, oil exports and exchange rate lowers the GDP in the short run by 0.01, 0.003 and 0.01% accordingly, all things being equal. However, a percentage increase in the manufacturing exports increased GDP by 0.01%. Since the effects of the variables were not statistically significant, no further explanation was provided.
Surprisingly, the findings in this study suggested that a unit increase in agricultural exports led to a reduction in non-export GDP and real GDP in the short run. This might be connected to a huge dependence on unprocessed agricultural produce, with relatively low returns, rather than processed or semi-processed agricultural products. The negative sign of agricultural exports in this model is evidence that exporting agricultural raw materials without value added reduces the competitiveness of Nigeria’s agriculture market36. This is because, during the period under review, the lopsided investment in the oil sector to the utter neglect of the agricultural sector contributed to the negative impact of the agricultural sector on both non-exports GDP and real GDP. To a large extent, it affects the structural transformation of the economy.
In summary, the major findings in this study were in line with the findings of other scholars, Verter and Bečvářová36, Awokuse and Xie37 and Osabohien et al.1, who investigated similar phenomenon in other developing countries, including Nigeria and found a positive and long-run relationship between agricultural exports, manufacturing exports and real GDP. The study highlights a significant decline in agricultural exports from $730 million in 2015 to -$550.9 million in 2017. This implies that Nigeria’s agricultural sector faces challenges that affect its contribution to export revenue.
The study underscores the heavy reliance on oil exports as the primary source of foreign exchange earnings, making Nigeria vulnerable to oil price fluctuations. The importance of diversifying the export revenue base is emphasized. The negative impact of unprocessed agricultural exports on non-export GDP and real GDP in the short run reveals a need for value addition and processing within the agricultural sector to enhance competitiveness. Policymakers and government bodies can use the study’s findings to shape economic policies aimed at boosting agricultural exports, diversifying export revenue sources and promoting value addition within the agricultural sector.
Export-oriented businesses and agricultural stakeholders can use the insights to develop strategies for improving their export performance and addressing challenges in the agricultural export market. Encouraging investments in value addition and processing of agricultural products can enhance the competitiveness of Nigeria’s agriculture market and boost export revenues. Nigeria should consider diversifying its export revenue sources beyond oil, focusing on strengthening the agricultural and manufacturing sectors to reduce dependency on a single export product. Policymakers should consider reforms that create an enabling environment for agricultural exporters, such as reducing trade barriers and improving infrastructure. The study’s findings are based on available data and the accuracy of the results relies on the quality and coverage of the data sources. The study provides insights into short-term dynamics, but longer-term effects and trends may require further investigation. The analysis does not account for external factors such as global economic conditions, trade policies of other countries and geopolitical events that can impact export performance. The study identifies relationships between variables but does not establish causality, which may require additional research and modeling.
CONCLUSION
This study analyzes the influence of agricultural, oil and manufacturing exports on Nigerian economic growth. Long-term findings indicate significant effects on economic growth, but short-term results vary. Agricultural exports negatively impact non-export economic growth, emphasizing the need for value addition. Manufacturing exports show a negative long-term impact but a positive short-term effect, highlighting market complexity. The study suggests enhancing value addition in agriculture and diversifying exports for economic growth.
SIGNIFICANCE STATEMENT
The study scrutinizes Nigeria’s agricultural, manufacturing and oil exports’ profound impact on non-export GDP and real GDP from 1962 to 2019, particularly given its oil-dependent economy. Robust data analysis reveals long-term effects, with agricultural exports and exchange rates positively affecting non-export GDP. Conversely, manufacturing exports negatively impact both non-export and real GDP. Surprisingly, oil exports significantly reduce real GDP but don’t notably affect non-export GDP. The study also addresses deviations from long-run equilibrium. Short-term insights highlight that a unit change in agricultural exports requires improved value addition for competitiveness while manufacturing exports significantly drive economic growth and real GDP expansion. Therefore, fostering conditions for manufacturing and agriculture growth is vital for economic expansion and enhanced real GDP.
REFERENCES
- Osabohien, R., D. Akinpelumi, O. Matthew, V. Okafor, E. Iku, T. Olawande and U. Okorie, 2019. Agricultural exports and economic growth in Nigeria: An econometric analysis. IOP Conf. Ser.: Earth Environ. Sci. 331.
- Zayone, T.I., S.R. Henneberry and R. Radmehr, 2020. Effects of agricultural, manufacturing, and mineral exports on Angola’s economic growth. Energies, 13.
- Arnold, J.M. and K. Hussinger, 2005. Export behavior and firm productivity in German manufacturing: A firm-level analysis. Rev. World Econ., 141: 219-243.
- Girma, S., H. Görg and M. Pisu, 2008. Exporting, linkages and productivity spillovers from foreign direct investment. Can. J. Econ., 41: 320-340.
- de Loecker, J., 2013. Detecting learning by exporting. Am. Econ. J. Microeconomics, 5: 1-21.
- Hammond, J.L., 2011. The resource curse and oil revenues in Angola and Venezuela. Sci. Soc., 75: 348-378.
- García-Rodríguez, J.L., F.J. García-Rodríguez, C. Castilla-Gutiérrez and S.A. Major, 2015. Oil, power, and poverty in Angola. Afr. Stud. Rev., 58: 159-176.
- Abayomi, A., S.O. Adam and A.I. Alumbugu, 2015. Oil exportation and economic growth in Nigeria. Dev. Country Stud., 5: 83-92.
- Usman, O.A. and A.O. Salami, 2008. The contribution of Nigerian export-import (NEXIM) bank towards export (non-oil) growth in Nigeria (1990-2005). Int. Bus. Manage., 2: 85-90.
- Osabohien R. and A.O. Bamigbola, 2017. Sustainable agricultural investment and employment generation in Nigeria: The role of institutional framework. FUTA J. Manage. Technol., 2: 113-123.
- Afolabi, A. and O.T. Laseinde, 2019. Manufacturing sector performance and economic growth in Nigeria. J. Phys.: Conf. Ser., 1378.
- Adeleye, N., E. Osabuohien, E. Bowale, O. Matthew and E. Oduntan, 2018. Financial reforms and credit growth in Nigeria: Empirical insights from ARDL and ECM techniques. Int. Rev. Appl. Econ., 32: 807-820.
- Gardner, B.L., 2005. Causes of rural economic development. Agric. Econ., 32: 21-41.
- Bravo-Ortega, C. and D. Lederman, 2005. Agriculture and National Welfare Around the World: Causality and International Heterogeneity Since 1960. World Bank Publications, Washington, DC, Pages: 50.
- Inekwe, E.I., E. Inekwe and M. Inekwe, 2021. Towards agricultural produce export diversification of the Nigerian economy: Integrating SWOT analysis with market intelligence for better performance. Int. J. Public Adm. Manage. Res., 5: 108-119.
- Oqubay, A., 2015. Made in Africa: Industrial Policy in Ethiopia. Oxford University Press, Oxford, ISBN: 9780198739890, Pages: 348.
- Mahmood, M., 2022. The Narrative for Sub-Saharan Africa. In: Growth, Jobs and Poverty in Sub-Saharan Africa: No Country Left Behind, Mahmood, M. (Ed.), Palgrave Macmillan, Cham, London, ISBN: 978-3-030-91574-2, pp: 1-22.
- Popescu, C.C. and L. Diaconu, 2021. Government spending and economic growth: A cointegration analysis on Romania. Sustainability, 13.
- Rudy, R. and M. Ichihashi, 2011. Exports and economic growth in Indonesia: A causality approach based on multi-variate error correction model. J. Int. Dev. Cooperation, 17: 53-73.
- Ijirshar, V.U., 2015. The empirical analysis of agricultural exports and economic growth in Nigeria. J. Dev. Agric. Econ., 7: 113-122.
- Matthew, O.A., C. Ede, R. Osabohien, J. Ejemeyovwi, T. Ayanda and J. Okunbor, 2021. Interaction effect of tourism and foreign exchange earnings on economic growth in Nigeria. Global Bus. Rev., 22: 7-22.
- Dickey, D.A. and W.A. Fuller, 1979. Distribution of the estimators for autoregressive time series with a unit root. J. Am. Stat. Assoc., 74: 427-431.
- Johansen, S., 1988. Statistical analysis of cointegration vectors. J. Econ. Dyn. Control, 12: 231-254.
- Enders, W., 2014. Applied Econometric Time Series. 4th Edn., Wiley, Hoboken, New Jersey, ISBN: 978-1-118-80856-6, Pages: 496.
- Engle, R.F. and C.W.J. Granger, 1987. Co-integration and error correction: Representation, estimation and testing. Econometrica, 55: 251-276.
- Engle, R.F. and J.V. Issler, 1995. Estimating common sectoral cycles. J. Monetary Econ., 35: 83-113.
- Gujarati, D.N, 2003. Basic Econometrics. 4th Edn., McGraw Hill, New York, ISBN: 9780072335422, Pages: 1002.
- Tekin, R.B., 2012. Economic growth, exports and foreign direct investment in Least Developed Countries: A panel Granger causality analysis. Econ. Modell., 29: 868-878.
- Aregbeyen, O. and B.O. Kolawole, 2015. Oil revenue, public spending and economic growth relationships in Nigeria. J. Sustainable Dev., 8: 113-123.
- Odularu, G.O., 2010. Rice trade policy options in an open developing economy: The Nigerian case study. J. Dev. Agric. Econ., 2: 166-177.
- Onwe, O.J., 2013. Trade balances and economic progress in Nigeria: Analysis of the oil and non-oil sub-sectors. Int. J. Bus. Soc. Sci., 4: 233-243.
- Akinlo, A.E., 2012. How important is oil in Nigeria's economic growth? J. Sustainable Dev., 5: 165-179.
- Ekperiware, M.C. and M.O. Olomu, 2015. Effect of oil and agriculture on economic growth in Nigeria. J. Global Econ. Manage. Bus. Res., 3: 75-86.
- Gatawa, N.M., Y.U. Dantama and M.B. Sani, 2017. Impact of export incentive schemes on the performance of agricultural exports in Nigeria. J. Econ. Bibliography, 4: 328-334.
- Sahu, T.N., K. Bandopadhyay and D. Mondal, 2014. An empirical study on the dynamic relationship between oil prices and Indian stock market. Managerial Finance, 40: 200-215.
- Verter, N. and V. Bečvářová, 2016. The impact of agricultural exports on economic growth in Nigeria. Acta Univ. Agric. Silviculturae Mendelianae Brunensis, 64: 691-700.
- Awokuse, T.O. and R. Xie, 2015. Does agriculture really matter for economic growth in developing countries? Can. J. Agric. Econ., 63: 77-99.
How to Cite this paper?
APA-7 Style
Ikuemonisan,
E.S., Kolawole,
E., Akinbola,
A.E. (2024). Economic Growth Effects of Agricultural, Manufacturing and Crude Oil Exports in Nigeria. Trends in Agricultural Sciences, 3(1), 17-28. https://doi.org/10.17311/tas.2024.17.28
ACS Style
Ikuemonisan,
E.S.; Kolawole,
E.; Akinbola,
A.E. Economic Growth Effects of Agricultural, Manufacturing and Crude Oil Exports in Nigeria. Trends Agric. Sci 2024, 3, 17-28. https://doi.org/10.17311/tas.2024.17.28
AMA Style
Ikuemonisan
ES, Kolawole
E, Akinbola
AE. Economic Growth Effects of Agricultural, Manufacturing and Crude Oil Exports in Nigeria. Trends in Agricultural Sciences. 2024; 3(1): 17-28. https://doi.org/10.17311/tas.2024.17.28
Chicago/Turabian Style
Ikuemonisan, Edamisan, Stephen, Emmauel Kolawole, and Adeyose Emmanuel Akinbola.
2024. "Economic Growth Effects of Agricultural, Manufacturing and Crude Oil Exports in Nigeria" Trends in Agricultural Sciences 3, no. 1: 17-28. https://doi.org/10.17311/tas.2024.17.28

This work is licensed under a Creative Commons Attribution 4.0 International License.