Predicting Monthly Heatwaves and Assessing their Impact on Summer Tomato Production
-
Mohammad Rasel

Bangladesh Agricultural Research Institute, Gazipur, Bangladesh
Istiaq AhmedBangladesh Agricultural Research Institute, Gazipur, Bangladesh
Abu HanifaInstitute of Statistical Research and Training, University of Dhaka, Dhaka, Bangladesh
Jamila Khatun PriotyBangladesh Agricultural Research Institute, Gazipur, Bangladesh
Limu AkterBangladesh Agricultural Research Institute, Gazipur, Bangladesh
M.A. Monayem MiaBangladesh Agricultural Research Institute, Gazipur, Bangladesh
| Received 15 Dec, 2025 |
Accepted 02 Jun, 2026 |
Published 30 Jun, 2026 |
Background and Objective: The global mean temperature is gradually increasing, which has become a serious environmental concern. Prolonged periods of high temperature often lead to heatwaves (HWs), causing substantial damage to agricultural production. This study aims to predict monthly heatwave occurrences and assess their impact on summer tomato production by examining the influence of key climatic factors on crop yield and overall performance. Materials and Methods: This study applied the Zero-Inflated Poisson (ZIP) model to predict the monthly Heat Wave Count (HWC). The impact of heatwaves on the yield of summer tomatoes cultivated in Gazipur district was examined using simple linear regression (LR). Agro-climatological gridded data (1982-2023) were obtained from the assimilation model (MERRA-2) of the NASA POWER Project, while summer tomato yield data (2004-2023) were collected from the Olericulture Division of the Horticulture Research Center (HRC), Bangladesh Agricultural Research Institute (BARI). Results: The findings revealed that heatwaves occurred in Gazipur district from March to May, with the highest frequency recorded in April. The number of heatwave days (HWDs) also peaked in April, and the duration of HWDs showed an increasing trend over the years. The ZIP model demonstrated reliable performance with low Mean Squared Error (MSE) and Mean Absolute Error (MAE) during the validation period (2022-2023). Moreover, a significant negative association was observed between heatwaves and summer tomato yield at the 5% significance level (p = 0.029). Conclusion: The results highlight the increasing occurrence of heatwaves and their adverse effects on summer tomato production in Gazipur district. The ZIP model showed strong potential for reliable heatwave prediction under changing climatic conditions, which could support climate-resilient agricultural planning and crop management strategies.
| Copyright © 2026 Rasel et al. This is an open-access article distributed under the Creative Commons Attribution License, which permits unrestricted use, distribution, and reproduction in any medium, provided the original work is properly cited. |
INTRODUCTION
Global average temperatures are rising, intensifying concerns about climate change and its effects on agricultural sustainability1. Heatwaves (HWs) are becoming more frequent and severe, posing serious risks to crop yields due to increased heat stress2,3. In Bangladesh, shorter winters and prolonged summers further heighten the likelihood of extreme heat during critical crop growth stages4,5. These conditions can significantly reduce agricultural productivity, making it essential to study heatwave patterns and their impacts to ensure food security and maintain farm profitability under changing climatic conditions.
In Bangladesh, tomato (Lycopersicon esculentum Mill.) is a widely cultivated and popular vegetable, traditionally grown in winter for optimal yield6. However, rising demand and profitability have expanded its cultivation into summer, supported by heat-tolerant hybrids developed by the Bangladesh Agricultural Research Institute (BARI), such as BARI Hybrid Tomato-3, -4, and -8, often grown under polytunnels6-8. Summer tomatoes are typically planted between April and July and harvested from August to October, but temperatures during this period frequently exceed the optimal range for fruit setting7,9-11. Although these varieties show some heat tolerance, excessive temperatures can still reduce yield by affecting flowering and fruit development3,12.
Many studies have examined heatwave (HW) prediction and summer tomato production separately. Hajong et al.7 and Karim et al.8 reported that BARI Hybrid-4 tomato farming is profitable, with high yields (50.41 t/ha), strong returns, and favorable benefit–cost ratios (2.64-3.04)7,8. However, HWs, along with pests, diseases, limited seed and credit access, and high production costs, remain major constraints13. Various methods have been used to predict HWs: Nissan et al.14 applied generalized additive models (GAMs), Jacques-Dumas et al.15 used deep learning, and Ke et al.16 applied machine learning based hybrid time series approaches14-16. While GAMs perform well without excessive zeros and machine/deep learning require large datasets, the Zero-Inflated Poisson (ZIP) model is specifically suited for data with many zeros17-19. Therefore, this study uses the ZIP model to predict HWs. To date, no research has statistically examined HW frequency alongside its impact on summer tomato production in Bangladesh. Thus, by combining yield effect evaluation with heatwave forecast in the context of Bangladesh, this study contributes to new knowledge. Its specific objectives are to forecast monthly heatwave occurrences using a suitable statistical modeling framework and assess how heatwaves affect summer tomato yield. This study offers empirical evidence to enhance climate-resilient agricultural planning and decision-making by establishing a connection between crop performance and climate extremes.
MATERIALS AND METHODS
Study area: In this study, the primary purpose is to derive a statistical model to predict the monthly HW as accurately as possible and to find the relationship (if any) between HW and the yield of summer tomato. As the yield trial of summer tomato is going on in the Olericulture Division, HRC, BARI for past few years, we selected Gazipur district (Latitude 23.9999, Longitude 90.4203) for monthly HW prediction.
Data source
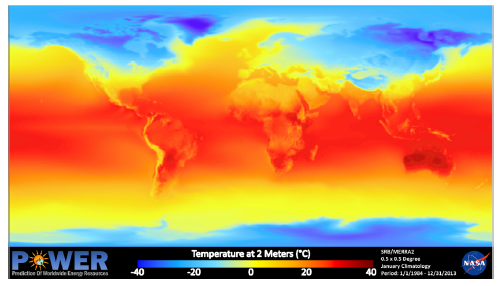
Agro-climatological data: To investigate the HW scenario in Gazipur district and develop a statistical model for monthly HW prediction the agro-climatological data were collected from the Prediction of Worldwide Energy Resources (POWER) project funded by the National Aeronautics and Space Administration (NASA) Earth Science Directorate Applied Science Program. The POWER project provides satellite and model-based, sufficiently accurate, reliable solar and meteorological resource data over regions where surface measurements are sparse or nonexistent20. The meteorological data inPOWERare based upon the Goddard’s Global Modeling and Assimilation Office (GMAO) Modern Era Retrospective-Analysis for Research and Applications (MERRA-2) assimilation model and GEOS 5.12.4 FP-IT. The data inPOWER are provided on a global grid with spatial resolutions equal to the input data. That resolution is ½° latitude by ⅝° longitude (About 50×62.5 km) for the meteorological data sets with the WGS84 (World Geodetic System 1984) grid reference system20. The parameters, related to the HW, we collected from the POWER project data are daily maximum temperature, minimum temperature, specific humidity, relative humidity, wind speed at 2 m, wind speed at 10 meters, wind direction at 2 m and, precipitation, surface soil wetness, profile soil moisture, and surface pressure from 01/01/1982 to 12/31/2023. The worldwide daily temperature, obtained from the MERRA-2 assimilation model of the POWER project, is depicted in Fig. 1.
|
| Table 1: | Classification and threshold of maximum temperature as per BMD | |||
| Types | Heatwaves maximum temperature (°C) | For calculation HW |
| Mild | 36-38 | ≥36 |
| Moderate | 38-40 | ≥40 |
| Severe | 40-42 | ≥42 |
| Extreme | >42 | >42 |
Summer tomato data: The Olericulture Division of HRC, BARI, has been conducting various experiments on two summer tomato varieties, BARI hybrid tomato-4 and BARI hybrid tomato-8, for a number of years to improve these varieties, as stated in their annual reports. These experiments include recording several parameters, such as the yield of these varieties. The annual yield (t/ha) data for summer tomatoes from 2004 to 2023 was obtained from the annual report of the Olericulture Division. The records for BARI hybrid tomato-4 cover the years 2004 to 2007, while the rest of the data is for BARI hybrid tomato-821.
Data arrangement: We obtained daily meteorological data from the above source and checked for outliers, missing values, and other anomalies. Detected outliers were replaced by the missing values in the data. Then, we searched for the heat wave days (HWD) using the maximum daily temperature based on the definition of HWDs and count the number of monthly HWDs, HWs. Other parameters in the study were used as the monthly average.
Heatwave definition: The World Meteorological Organization (WMO) defines a heatwave (HW) as unusually hot weather persisting for at least two consecutive days during the hot season, with temperatures exceeding a set threshold22. This study adopts WMO’s definition alongside the Bangladesh Meteorological Department’s (BMD) maximum temperature thresholds (Table 1). Using these criteria, mild HW is defined as ≥36°C for two or more consecutive days, with similar thresholds applied for moderate, severe, and extreme HWs23.
Statistical analysis: In our investigation of the heat wave (HW) scenario and its impact on the yield of summer tomatoes, we utilized several statistical tools. We employed Spearman’s rank correlation to determine the correlation between the number of heat waves and various climatological parameters due to the zero-inflated, over-dispersed, and right-skewed nature of the monthly HW data24,25. Additionally, we used the Zero Inflated Poisson (ZIP) model, which is designed for count models with excessive zeros, to further our research objectives18,26. To evaluate the predictive performance of the ZIP model, we mployed Mean Squared Error (MSE)12,27 and Mean Absolute Error (MAE)28 . Furthermore, we utilized Linear Regression (LR) models to assess the impact of HWs on the yield of summer tomatoes29,30. All analyses were conducted using R software.
Zero-inflated poisson (ZIP) regression: The ZIP regression is a model for count data with excess zeros18,26.
Suppose a random variable, X follows the usual Poisson distribution with parameter λ, Poi(λ), with the following probability mass function (Eq. 1).
| (1) |
(P(X = k)) denotes the probability of observing (k) events. (π) is the Poisson rate parameter representing the average number of occurrences within a fixed interval. (k) is the count variable taking non-negative integer values.
Can be used to model many count data (for example: The number of yearly heatwaves). Note that X takes only nonnegative integer values. However, the Poi(λ) distribution may not be useful (or it gives a bad fit) when X takes the value 0 with a high probability20. In such a case a modified version of a regular Poi(λ) distribution known as the zero-inflated Poisson (ZIP) distribution becomes useful19,26. The ZIP distribution with parameters π and λ, denoted by ZIP (π, λ), has the following probability mass function (Eq. 2).
| (2) |
(P(X = k)) denotes the probability of observing (k) events under the zero-inflated Poisson (ZIP) model. (π) represents the probability of excess (structural) zeros, while ((1-π)) is the probability of counts arising from the standard Poisson process. (π) is the mean (rate parameter) of the Poisson component. (k) takes non-negative integer values, and (e) is the base of the natural logarithm.
where 0 ≤ π≤1 and λ≥0. The parameter π gives the extra probability thrust at the value 0; when it vanishes, ZIP (π, λ) reduces to Poi(λ).
RESULTS AND DISCUSSION
Exploratory data analysis: The variables associated with the occurrences of HW are provided in Table 2 along with the descriptive analysis. Table 2 shows that the daily maximum temperature is 44.47°C, while the minimum temperature is 3.43°C. The maximum precipitation is 167.28 mm/day, and the average daily rainfall is 9.72 mm/day in Gazipur district. We found that the yearly maximum number of HW is 12, while no HW is also observed in a year with a standard deviation 2.91. The average relative humidity, surface pressure, wind speed at 2 m, and soil moisture is observed 70.56%, 100.67 Kpa, 2.04 m/sec, 0.58 (moderate saturated soil), respectively. The later section revealed more findings about climate parameters and HWs obtained in our research.
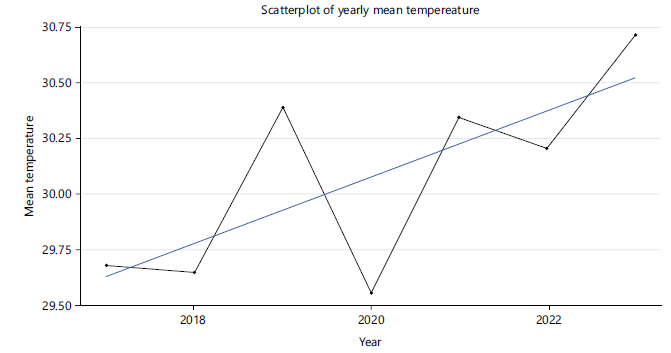
The graph in Fig. 2 illustrates the trend of the average daily maximum temperature in Gazipur district from 2017 to 2023. The data shows a consistent increase in the mean daily maximum temperature over the years. This increasing pattern is causing an alarming situation for the people of Gazipur district, and hence Bangladesh. This situation has led us to conduct this research.
|
|
| Table 2: | Descriptive statistics of climate parameters (measured daily): 1982-2023 | |||
| Variables of the interest | Mean | Standard deviation | Minimum | Maximum |
| Heatwave (No./year) | 6.38 | 2.91 | 0 | 12 |
| Maximum temperature (°C) | 31.24 | 3.93 | 16.38 | 44.47 |
| Minimum temperature (°C) | 21.21 | 5.43 | 3.43 | 29.42 |
| Specific humidity (g/kg) | 14.93 | 5.77 | 2.2 | 23.99 |
| Relative humidity (%) | 70.56 | 17.76 | 12.56 | 95.75 |
| Precipitation (mm/day) | 4.89 | 9.72 | 0 | 167.28 |
| Surface pressure (Kpa) | 100.67 | 0.55 | 98.94 | 101.98 |
| Wind speed at 2 m (m/sec) | 2.04 | 1.01 | 0.4 | 9.16 |
| Wind speed at 10 m (m/sec) | 3.01 | 1.37 | 0.58 | 12.95 |
| Wind direction at 2-meter (degree) | 188.83 | 58.31 | 17.06 | 348.62 |
| Surface soil wetness (0-1: Index) | 0.59 | 0.21 | 0.09 | 0.99 |
| Profile soil moisture (0-1: Index) | 0.58 | 0.17 | 0.34 | 0.98 |
Scenerarios of heatwaves
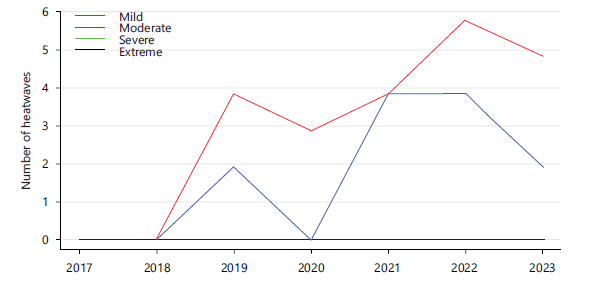
Yearly heatwave: According to the definition of heatwaves (HW) given above (Table 1), we have calculated the occurrences of mild, moderate, severe, and extreme HWs. The analysis of heatwave occurrences is presented in Fig. 3. The occurrences of mild and moderate heatwaves have increased over the years, but no severe and extreme heatwaves have been observed in Gazipur district from 2017 to 2023.
|
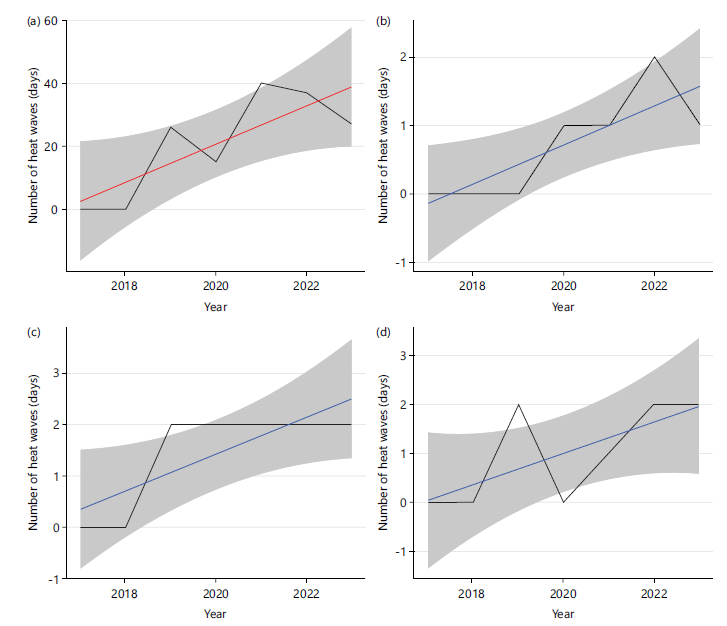
This means no two or more consecutive days have a temperature greater than 40 degrees. However, it is possible for the temperature to be below 40 degrees one day and above 40 degrees the next day. On those days, we may feel extremely hot, but we do not count them as severe or extreme HW days. The graph in Fig. 4a illustrates a gradual increase in the yearly count of mild heatwaves.
In our observations from Fig. 4a, we noted that there were no heatwave occurrences from 2017 to 2018, indicating that the temperature remained below the threshold of 36. However, in this study, we did not investigate the reasons behind this.
Monthly heatwave: In this research, one of our specific objectives was to explore the current scenario of HW in Bangladesh. The results for the HW scenarios in Gazipur district are presented in yearly and monthly heatwave paragraphs, based on the POWER project data from NASA. We specifically chose to focus on Gazipur district because the POWER project provides gridded (50×62.5 km) data20.
Using data for the entire Bangladesh would not accurately represent the country. Figure 4(b-d) illustrates the monthly heatwave scenario in Gazipur district for March, April, and May. No heatwaves are observed other than in these months, and we found that the number of heatwaves is gradually increasing. Additionally, we observed no HW in March 2017-2019 and April-May 2017-2018 in the Fig. 4(b-d).
|
|
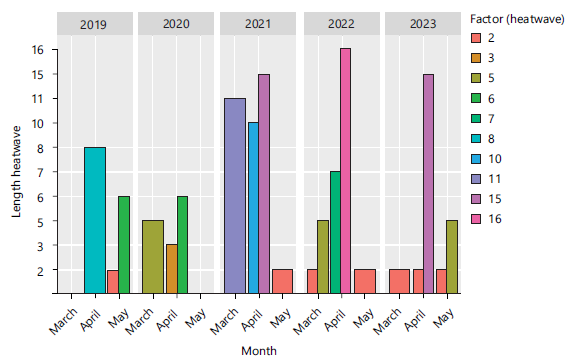
The monthly duration of heat wave days (HWDs) is illustrated in Fig. 5. The data shows that the size of HWDs is increasing from 2019 to 2023. More specifically, in 2019, March experienced a total of 8 days with temperatures exceeding 36°C, which was the maximum for that year. In 2020, the highest number of HWDs occurred in April, with 6 days exceeding 36°C. In 2021, April saw the maximum number of HWDs with 15 days exceeding 36°C. The year 2022 experienced the most HWDs, with 16 occurring in May. Lastly, in 2023, the maximum number of HWDs in April was 15 days with temperatures greater than 36°C.
Prediction of monthly heatwave using ZIP model: Before fitting the ZIP model in this section, we performed a Spearman’s rank correlation analysis of the number of monthly heatwaves (HW) with other variables identified in the literature as potentially associated with heatwaves. We also conducted a correlation test to identify variables significantly correlated with the occurrence of heatwaves. The references for the literature are provided.
| Table 3: | Correlation test of MHWC with agroclimatogical parameters of POWER data | |||
| Climate parameters with MHWC | Spearman’s rank correlation coefficient | p-value |
| Maximum temperature | 0.62 | 0.00*** |
| Specific humidity | 0.1 | 0.37 |
| Relative humidity | -0.46 | 0.00*** |
| Precipitation | -0.03 | 0.8 |
| Surface pressure | 0.06 | 0.5 |
| Wind speed at 2 m | 0.2 | 0.06▪ |
| Wind speed at 10 m | 0.19 | 0.08▪ |
| Wind direction at 2 m | -0.033 | 0.76 |
| Wetness | -0.5 | 0.00*** |
| Soil moisture | -0.51 | 0.00*** |
| ***Significant at 0.1%, **Significant at 1% and *5% level of significance | ||
| Table 4: | Zero inflated poisson model estimations | |||
| Count model coefficients with log link | |||
| Coefficient | Std. Error | p-value | |
| Maximum temperature | 0.17 | 0.06 | 0.004** |
| Relative humidity | 0.002 | 0.023 | 0.927 |
| Wind speed at 2 m | 1.29 | 2.71 | 0.635 |
| Wind speed at 10 m | -0.98 | 1.98 | 0.621 |
| Soil wetness | 7.28 | 2.92 | 0.012* |
| Soil moisture | -11.84 | 4.09 | 0.003** |
| Intercept | -3.07 | 2.66 | 0.248 |
| Zero-Inflation model coefficients with binomial logit link | |||
| Maximum temperature | -4.8806 | 2.63 | 0.063▪ |
| Relative humidity | 0.2029 | 0.14 | 0.128 |
| Wind speed at 2 m | 50.1241 | 46.55 | 0.281 |
| Wind speed at 10 m | -38.4949 | 35.37 | 0.276 |
| Soil moisture | -20.19 | 15.94 | 0.205 |
| Intercept | 168.2504 | 15.94 | 0.077▪ |
| ***Significant at 0.1%, **Significant at 1% and *5% level of significance | |||
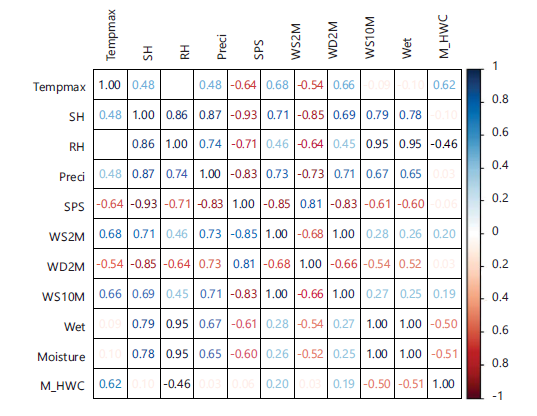
Correlation analysis: In Fig. 6, after conducting a correlation analysis, we have decided to include the variables in the ZIP model. In Fig. 6 M_HWC, the monthly heatwave count (MHWC) is moderately positively correlated (r = 0.62) with maximum temperature, and has a moderate negative relationship with relative humidity (RH), soil wetness (WET), and soil moisture (Moisture) with correlation coefficients of -0.46, -0.50, and -0.51, respectively. There is a weak association observed with specific humidity (SH), precipitation (Preci), surface pressure (SPS), wind speed at 2 and 10 m (WS2M), and wind direction at 2 m (WD2M).
In Table 3, we observed that the maximum daily temperature is highly significantly associated with MHWC, and relative humidity, soil wetness, and soil moisture are also highly significantly associated with MHWC with a p-value of 0.000. We found that as the maximum temperature increases, the MWHC will increase. Additionally, we found that an increase in relative humidity, soil wetness, and soil moisture leads to a decrease in MHWC. Unfortunately, we did not find a significant association between the amount of monthly precipitation and MHWC, but it can be inferred from the analysis that an increase in monthly precipitation results in a decrease in MHWC. Moreover, we found a significant positive correlation between wind speed at 2 and 10 m, with p-values of 0.06 and 0.08, respectively. However, we did not find any significant association between surface pressure and wind direction.
Heatwave prediction: In the ZIP model, there are two parts: The count model and the zero-inflated model (binomial logit). Based on the correlation analysis, we included maximum temperature, relative humidity, soil wetness, soil moisture, and wind speed at 2 and 10 m in the count model. These variables, with the exception of wind direction, are included in the zero-inflated model. The data was divided into two parts: A training set from 1982 to 2021 and a validation set from 2022-2023.
|
The results of the ZIP model are presented in Table 4. The count model with a log link showed that maximum temperature (β = 0.17, p = 0.004), soil wetness (β = 7.28, p = 0.012), and soil moisture (β = -11.84, p = 0.003) were significant predictors of the response variable, while relative humidity and wind speeds were not significant. In the zero-inflation (logit) model, no variables were statistically significant at the 5% level, although maximum temperature and the intercept showed marginal significance, indicating a weak contribution to excess zero counts.
Our analysis in Table 3 shows that maximum temperature and soil moisture have a significant influence on the prediction of monthly heatwave count at a 0.1% significance level, with p-values of 0.004 and 0.003, respectively. Additionally, soil wetness is significantly associated with a 1% significance level. In the inflation model, we also found that temperature significantly contributes to the occurrence of zero heatwave counts.
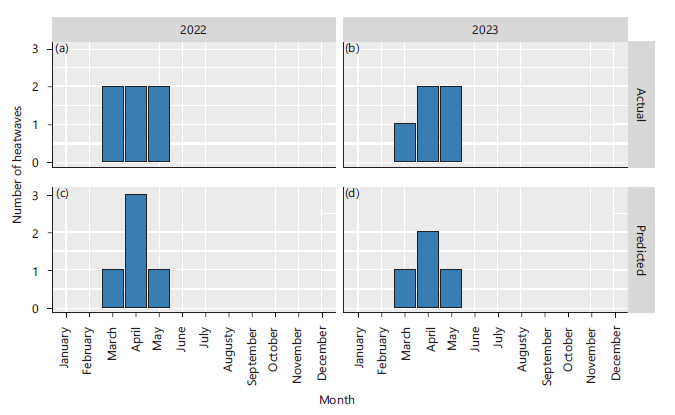
Figure 7(a-d) presents the predicted and actual MWHC for the Gazipur district in 2022-2023 as obtained from the ZIP model. Heatwaves were observed only in March, April, and May. In 2022, the actual MWHC was 2 in March, April, and May (Fig. 7a), while the predicted MWHC was 1, 3, and 1 for March, April, and May respectively (Fig. 7c). In 2023, we observed actual MWHC values of 1, 2, and 2 in March, April, and May respectively (Fig 7-b), while the predicted values were 1, 2, and 1 for the same months (Fig 7d). The accuracy of the ZIP model’s predictions was assessed using MAE and MSE. A lower MAE and MSE indicates better predictive performance12,27. The obtained value for the predicted model is 0.1667, which is very close to zero, indicating a strong performance in predicting MWHC.
Effects of MHWC on the yield of summer tomato: Two BARI-developed hybrid varieties namely BARI tomato-4 and BARI tomato-8 are heat-tolerant4. However, we would like to investigate the potential impact of MHWCs and MHWDs on the yield of summer tomatoes in Bangladesh.
|
|
| Table 5: | Linear regression estimates of yield of summer tomatoes with HWC | |||
| Variables | Coefficients | Std. error | t-value | p-value |
| HWC | -1.5414 | 0.6497 | -2.373 | 0.029* |
| Intercept | 49.832 | 3.5584 | 14.004 | 0.000*** |
| P-value for overall model significance: 0.02901 | ||||
| Adjusted R2: 20% ***Significant at 0.1%, **Significant at 1% and *5% level of significance |
||||
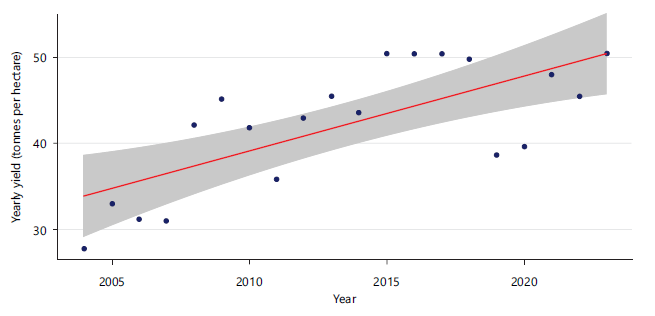
The average yield of summer tomatoes was 42.12 tons per hectare, with a standard deviation of 7.24. The minimum and maximum yields were 27.70 tons per hectare and 50.41 tons per hectare, respectively. In Fig. 8, a line diagram illustrating the yearly yield of summer tomatoes, it is evident that there has been an increase in the yield of summer tomatoes.
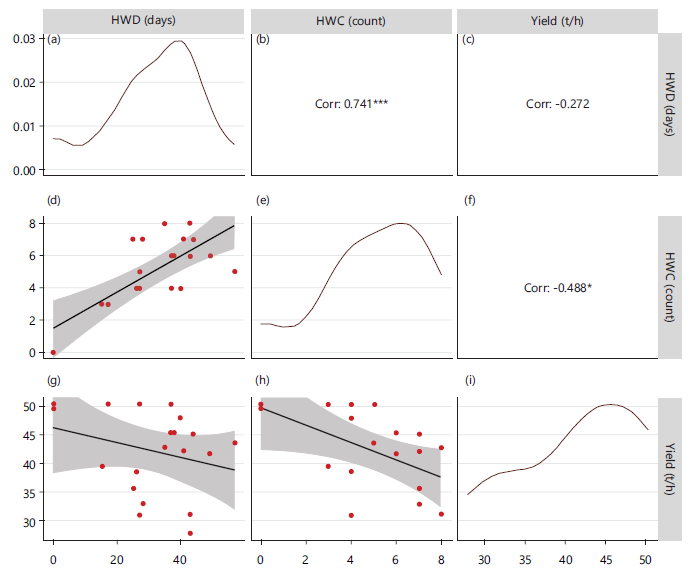
In Fig. 9(a-i), a correlogram is presented. Scatter plots are visualized in the lower diagonal, density plots are in the diagonal, and the Pearson correlation coefficient with the significance level is displayed in the upper diagonal. We observed that as the yearly HWC and HWD increase, the yield decreases for each pair of scatterplots (Fig. 9(g-h)). We also found that there is a significant negative correlation between the yield and HWC, with a correlation coefficient of -0.488 at a significance level of 5% (Fig. 9f). Additionally, the correlation between HWD and yield is -0.272, indicating a negative linear relationship between them (Fig. 9c). These negative correlation coefficients indicate also that for the increase of HWCs and HWDs, the yield of summer tomato decreases.
The correlation coefficients show the strength of the association between variables, but they do not establish causation31. To investigate the causation of yield and HWC, we conducted a linear regression analysis in this study. The LR estimates are presented in Table 5, and we observed that the overall model is significant with a p-value of 0.029. This indicates that the estimated model is more effective than the null model in predicting and explaining the yield of summer tomatoes. The coefficient of determination, adjusted R-squared, is 20% for the model, meaning that only HWC explains 20% of the total variation in the yield of summer tomatoes. Other characteristics influencing yield, such as plant height, number of leaves per plant, number of branches per plant, virus infestation (%), fruit length and diameter, individual fruit weight, number of locules, and total soluble solid (TSS) content, as shown by Biswas et al.32 could increase the adjusted R-squared. However, this is beyond the scope of our study32.
Our analysis indicated that the coefficient of HWC is significantly different from 0, as its p-value is 0.029, which is less than 0.05. This provides evidence that HWC has a significant effect on the yield of summer tomatoes in Bangladesh, which was one of the specific objectives of this program. The intercept, 49.8320, is also highly significant with a p-value of 0.000, indicating that the average yield of summer tomatoes in Bangladesh is 49.8320 (t/ha) when no other variables are considered in the model. The coefficient of HWC is -1.5414, meaning that an increase in HWC by one day per year will result in a decrease of 1.5414 (t/ha) in the yield of summer tomatoes.
CONCLUSION
This study developed and evaluated the performance of a ZIP model for monthly heatwave (HW) prediction in Gazipur district, using assimilation model (MERRA-2) agro climatological data. The study also investigated the impacts of HWs on the yield of summer tomatoes. The predictive model performed well in predicting HWs during the validation period, 2022-2023, with very low (0.167 for both) Mean Squared Error (MSE) and Mean Absolute Error (MAE). This study also showed significant negative effects of HWs on the yield of summer tomatoes. The findings suggest that policymakers may utilize the predictive model to anticipate HWs two years in advance, helping to reduce damages to summer tomato production in Bangladesh. By adjusting the sowing and harvest time of summer tomatoes based on the early HW
predictions, the overall yield can be increased, potentially preventing yield reduction. However, it is important to note that the monthly HW predictions are specific to the Gazipur district, and future research may focus on developing region-specific predictive ZIP models for short, mid, and long-term predictions, as well as creating spatial maps of HWs in Bangladesh. Additionally, forecasting the yield of summer tomatoes based on the findings of this study may contribute to a better understanding of growing demand.
SIGNIFICANCE STATEMENT
This study provides a practical framework for predicting heatwave occurrences using a Zero-inflated Poisson model and demonstrates their significant negative impact on summer tomato yield. The findings offer valuable insights for climate-resilient agricultural planning, enabling policymakers and farmers to anticipate extreme temperature events and adjust crop management practices to minimize yield losses and improve productivity under changing climatic conditions.
ACKNOWLEDGMENT
The authors are thankful to the POWER project funded by NASA for their open-source gridded agroclimatic data for the Gazipur district. I want to express my special gratitude to Dr. AKM Quamruzzaman, Chief Scientific Officer and Head of the Olericulture Division at HRC, BARI, and to Dr. Muhammad Nazim Uddin, Senior Scientific Officers in the same department, for providing the summer tomato yield data for this study.
REFERENCES
- Scherm, H. and A.H.C. van Bruggen, 1994. Global warming and nonlinear growth: How important are changes in average temperature? Phytopathology, 84: 1380-1384.
- Steffen, W., L. Hughes and S. Perkins, 2014. Heatwaves: Hotter, Longer, More Often. Climate Council of Australia, Sydney, Australia, 978-0-9924142-3-8, Pages: 62.
- Roberts, M.J. and W. Schlenker, 2012. Is Agricultural Production Becoming More or Less Sensitive to Extreme Heat? Evidence from U.S. Corn and Soybean Yields. In: The Design and Implementation of US Climate Policy, Fullerton, D. and C. Wolfram (Eds.), National Bureau of Economic Research, Cambridge, Massachusetts, ISBN: 9780226269146, pp: 271-282.
- Fan, X., D. Zhu, X. Sun, J. Wang, M. Wang, S. Wang and A.E. Watson, 2022. Impacts of extreme temperature and precipitation on crops during the growing season in South Asia. Remote Sens., 14.
- Siddik, M.A.Z. and M. Rahman, 2014. Trend analysis of maximum, minimum, and average temperatures in Bangladesh: 1961-2008. Theor. Appl. Climatol., 116: 721-730.
- Zaman, M.M., A.S.M. Anawarul Huq and M.J.A. Chowdhury, 2006. Production potentiality of summer tomato in Jamalpur region. Int. J. Sustainable Crop Prod., 1: 12-15.
- Hajong, P., B. Sikder, S. Mondal and M.A. Islam, 2018. Adoption and profitability of summer tomato cultivation in Jashore District of Bangladesh. Bangladesh J. Agric. Res., 43: 575-585.
- Karim, M.R., M.S. Rahman and M.S. Alam, 2010. Profitability of summer BARI hybrid tomato cultivation in Jessore District of Bangladesh. J. Agric. Rural Dev., 7: 73-79.
- der van Ploeg and E. Heuvelink, 2005. Influence of sub-optimal temperature on tomato growth and yield: A review. J. Hortic. Sci. Biotechnol., 80: 652-659.
- Hunter, B., D. Drost, B. Black and R. Ward, 2012. Improving growth and productivity of early-season high-tunnel tomatoes with targeted temperature additions. HortScience, 47: 733-740.
- Stevens, M.A. and J. Rudich, 1978. Genetic potential for overcoming physiological limitations on adaptability, yield, and quality in the tomato. HortScience, 13: 673-678.
- Das, K., J. Jiang and J.N.K. Rao, 2004. Mean squared error of empirical predictor. Ann. Stat., 32: 818-840.
- Das, S.B., M. Shahidul Islam, M. Nazim Uddin, B.K. Goswami, S.M. Shafiul Abedin and M. Abdul Baki, 2024. Evaluation of the performance of summer tomato lines in Bangladesh conditions. J. Biosci., 31: 13-23.
- Nissan, H., K. Burkart, E.C. de Perez, M. van Aalst and S. Mason, 2017. Defining and predicting heat waves in Bangladesh. J. Appl. Meteorol. Climatol., 56: 2653-2670.
- Jacques-Dumas, V., F. Ragone, P. Borgnat, P. Abry and F. Bouchet, 2022. Deep learning-based extreme heatwave forecast. Front. Clim., 4.
- Ke, D., K. Takahashi, J. Takakura, K. Takara and B. Kamranzad, 2023. Effects of heatwave features on machine-learning-based heat-related ambulance calls prediction models in Japan. Sci. Total Environ., 873.
- Green, J.A., 2021. Too many zeros and/or highly skewed? A tutorial on modelling health behaviour as count data with poisson and negative binomial regression. Health Psychol. Behav. Med., 9: 436-455.
- Lambert, D., 1992. Zero-inflated poisson regression, with an application to defects in manufacturing. Technometrics, 34: 1-14.
- Beckett, S., J. Jee, T. Ncube, S. Pompilus, Q. Washington, A. Singh and N. Pal, 2014. Zero-inflated Poisson (ZIP) distribution: Parameter estimation and applications to model data from natural calamities. Involve, 7: 751-767.
- Duarte, Y.C.N. and P.C. Sentelhas, 2020. NASA/POWER and daily gridded weather datasets-how good they are for estimating maize yields in Brazil? Int. J. Biometeorol., 64: 319-329.
- Quamruzzaman, A., L. Akter and F. Islam, 2023. Yield and pest performance of high-temperature tolerant tomato (Lycopersicon esculentum) lines for year-round tomato production in Bangladesh. Agric. Sci., 14: 855-863.
- WMO and WHO, 2016. Heatwaves and Health: Guidance on Warning-System Development. World Health Organization, Geneva, Switzerland, ISBN: 978-92-63-11142-5, Pages: 96.
- Bazlur Rashid, M., S.S. Hossain, M. Abdul Mannan, K.M. Parding, H.O. Hygen, R.E. Benestad and A. Mezghani, 2021. Climate change projections of maximum temperature in the pre-monsoon season in Bangladesh using statistical downscaling of global climate models. Adv. Sci. Res., 18: 99-114.
- Hauke, J. and T. Kossowski, 2011. Comparison of values of pearson's and spearman's correlation coefficients on the same sets of data. Quaestiones Geographicae, 30: 87-93.
- White, G.C. and R.E. Bennetts, 1996. Analysis of frequency count data using the negative binomial distribution. Ecology, 77: 2549-2557.
- Kim, D.W., R.C. Deo, S.J. Park, J.S. Lee and W.S. Lee, 2019. Weekly heat wave death prediction model using zero-inflated regression approach. Theor. Appl. Climatol., 137: 823-838.
- Hodson, T.O., 2022. Root-mean-square error (RMSE) or mean absolute error (MAE): When to use them or not. Geosci. Model Dev., 15: 5481-5487.
- Karunasingha, D.S.K., 2022. Root mean square error or mean absolute error? Use their ratio as well. Inf. Sci., 585: 609-629.
- Seber, G.A.F. and A.J. Lee, 2012. Linear Regression Analysis. Wiley-Interscience, Hoboken, New Jersey, ISBN: 9781118274422, Pages: 592.
- Weisberg, S., 2005. Applied Linear Regression. 3rd Edn., John Wiley and Sons, USA, ISBN: 9780471704096, Pages: 336.
- Osborne, J.W. and E. Waters, 2002. Four assumptions of multiple regression that researchers should always test. Pract. Assess. Res. Eval., 8.
- Biswas, M., D.R. Sarkar, M.I. Asif, R.K. Sikder, H. Mehraj and A.F.M. Jamal Uddin, 2014. Comparison of growth and yield characteristics of BARI tomato varieties. J. Biosci. Agric. Res., 3: 1-7
How to Cite this paper?
APA-7 Style
Rasel,
M., Ahmed,
I., Hanifa,
A., Prioty,
J.K., Akter,
L., Mia,
M.M. (2026). Predicting Monthly Heatwaves and Assessing their Impact on Summer Tomato Production. Trends in Agricultural Sciences, 5(2), 23-35. https://doi.org/10.21124/tas.2026.23.35
ACS Style
Rasel,
M.; Ahmed,
I.; Hanifa,
A.; Prioty,
J.K.; Akter,
L.; Mia,
M.M. Predicting Monthly Heatwaves and Assessing their Impact on Summer Tomato Production. Trends Agric. Sci 2026, 5, 23-35. https://doi.org/10.21124/tas.2026.23.35
AMA Style
Rasel
M, Ahmed
I, Hanifa
A, Prioty
JK, Akter
L, Mia
MM. Predicting Monthly Heatwaves and Assessing their Impact on Summer Tomato Production. Trends in Agricultural Sciences. 2026; 5(2): 23-35. https://doi.org/10.21124/tas.2026.23.35
Chicago/Turabian Style
Rasel, Mohammad, Istiaq Ahmed, Abu Hanifa, Jamila Khatun Prioty, Limu Akter, and M.A. Monayem Mia.
2026. "Predicting Monthly Heatwaves and Assessing their Impact on Summer Tomato Production" Trends in Agricultural Sciences 5, no. 2: 23-35. https://doi.org/10.21124/tas.2026.23.35

This work is licensed under a Creative Commons Attribution 4.0 International License.