Multivariate Analysis of Agronomic and Nutritional Traits in Diverse Pawpaw (Carica papaya L.) Varieties
-
Adesike O. Olayinka


Crop Production and Soil Science Department, Ladoke Akintola University of Technology, PMB 4000, Ogbomoso, Nigeria
Dorcas O. IbitoyeGenetic Resources Unit, National Horticultural Research Institute, PMB. 5432, Ibadan, Nigeria
Abiodun F. OlayinkaUniversity of Ghana, Legon, Accra, Ghana
Olufemi S. AkandeCrop Production and Soil Science Department, Ladoke Akintola University of Technology, PMB 4000, Ogbomoso, Nigeria
Peter A. AdebayoCrop Production and Soil Science Department, Ladoke Akintola University of Technology, PMB 4000, Ogbomoso, Nigeria
Godswill O. UjahCrop Production and Soil Science Department, Ladoke Akintola University of Technology, PMB 4000, Ogbomoso, Nigeria
Oluwakemi O. FatokiCrop Production and Soil Science Department, Ladoke Akintola University of Technology, PMB 4000, Ogbomoso, Nigeria
| Received 08 Dec, 2025 |
Accepted 14 May, 2026 |
Published 30 Jun, 2026 |
Background and Objective: Pawpaw (Carica papaya L.) is an important tropical fruit valued for its agronomic, nutritional, and economic traits. Significant variability among varieties necessitates identifying superior genotypes for breeding, production, and processing. This study evaluated thirteen pawpaw varieties from the National Horticultural Research Institute (NIHORT), Ibadan, Nigeria, for their agronomic traits, nutritional properties, and bioactive compounds. Materials and Methods: Agronomic data were collected and analyzed, and standardized AOAC laboratory protocols were used to analyze samples. Data on agronomic and nutritional parameters underwent multivariate statistical analyses using R software to assess phenotypic diversity and trait associations. Results: Significant variation (p<0.05) was observed across varieties for most traits. Principal component analysis identified key contributors to variation, including flowering nodes, growth parameters, fruit weight, and antioxidant content. Correlation analysis revealed strong positive links among minerals and antioxidants. Hierarchical clustering classified varieties into three distinct agronomic-nutritional groups. Genotype by Yield×Trait analysis ranked varieties, highlighting Varieties 10, 17, and 8 as top performers combining yield and nutritional superiority. Conclusion: Multivariate and Genotype by Yield×Trait analyses effectively identified promising pawpaw varieties with enhanced productivity and nutritional quality, informing breeding and selection strategies for improved pawpaw cultivars.
| Copyright © 2026 Olayinka et al. This is an open-access article distributed under the Creative Commons Attribution License, which permits unrestricted use, distribution, and reproduction in any medium, provided the original work is properly cited. |
INTRODUCTION
Pawpaw (Carica papaya L.) is a globally important fruit crop valued for its superior agronomic traits, nutritional richness, and economic potential. Carica papaya, the sole species in the genus Carica, is a dicotyledonous, polygamous plant bearing male, female, and hermaphrodite flowers. Its adaptability to tropical and subtropical environments, combined with rapid growth and year-round fruiting, amplifies its
role in enhancing food security and generating income for smallholder and commercial farmers1,2. This versatility supports diverse consumption patterns, fresh, dried, and processed forms meeting varied consumer preferences and market demands. Furthermore, pawpaw’s bioactive compounds, including the proteolytic enzyme papain, drive demand in pharmaceutical, cosmetic, and medicinal industries due to their therapeutic applications3,4.
Pawpaw ranks highest among 38 common fruits in providing vitamins A and C as a percentage of the U.S. recommended daily allowance (RDA). Nutritionally, pawpaw is distinguished by its high content of vitamins and beta-carotene, essential minerals such as potassium, calcium, and iron, along with dietary fiber and alpha amino acids, contributing to human and animal diets2,5,6. Its antioxidant properties further enhance its health benefits by supporting immune function and mitigating oxidative stress, as supported by multiple studies3,7.
Pawpaw production in Nigeria is predominantly subsistence-based, with most farmers relying on wild-growing plants due to limited knowledge of improved cultivation practices and high-yielding varieties8. Effective breeding programmes depend on genetic resources that enhance both yield and diversity. Therefore, systematic evaluation and comprehensive characterization of newly acquired germplasm are critical to fully utilize novel trait sources, facilitate the incorporation of valuable genetic variation, and accelerate varietal development and crop improvement9. Substantial variation exists among pawpaw varieties regarding key agronomic traits such as fruit yield, size, shape, and shelf life. Single-trait assessments fail to capture the complex relationships among these traits; hence, multivariate analyses like principal component and cluster analyses are vital for integrative trait characterization and the identification of superior genotypes with optimal agronomic and nutritional profiles for breeding and commercialization10,11. Additionally, providing farmers with guidance on variety selection aligned with consumer preferences is necessary to enhance adoption and marketability12.
Furthermore, the use of the Genotype by Yield×Trait (GYT) biplot approach of Yan and Frégeau-Reid13 advances selection by simultaneously considering yield alongside multiple agronomic and nutritional traits. This approach enables identification of genotypes that combine high yield with desirable quality attributes, reflecting the complex trade-offs inherent in breeding decisions. By integrating yield with trait profiles, GYT facilitates the selection of superior varieties that meet both production efficiency and market quality criteria, supporting more holistic breeding outcomes. There is a lack of information on selecting pawpaw accession varieties using the GYT biplot approach.
This study aims to identify significant variability among pawpaw varieties in agronomic and nutritional traits; elucidate relationships between these traits; determine key traits driving varietal variation; select a superior pawpaw variety based on fruit yield and other desirable traits using the GYT biplot approach; and classify varieties into distinct groups based on comprehensive trait profiles to guide targeted breeding and selection strategies.
MATERIALS AND METHODS
Study area: Field trials were conducted at the National Horticultural Research Institute (NIHORT), Ibadan, Oyo State, Nigeria (7°22 N, 3°54 E), from planting in April 2024 to the first harvest in February 2025, with subsequent harvests made as fruits reached physiological maturity.
Planting materials: Thirteen pawpaw varieties (var), including improved lines and landraces sourced from the breeding programme of NIHORT, were evaluated in this study (Table 1). Uniformly ripe and healthy fruits were harvested from pre-tagged plants. For each variety, 4-5 representative fruits were collected to ensure consistency and minimize sampling bias.
| Table 1: | List of pawpaw varieties evaluated and their qualitative traits | |||
| Genotype | Stem pigmentation | Fruit skin colour | Fruit flesh colour | Fruit shape | Flower | Source |
| Var 1 | Green and shades of red and purple |
Yellowish green | Reddish orange | High round | Hermaphrodite flowers only | NIHORT |
| Var 2 | Green and shades of red and purple |
Yellow | Yellow | Oval | Hermaphrodite flowers only | NIHORT |
| Var 4 | Green and shades of red and purple |
Yellow | Yellow | Oval | Staminate flowers and a few hermaphrodite flowers |
NIHORT |
| Var 5 | Green and shades of red and purple |
Yellow | Yellow | High round | Few staminate and many hermaphrodite flowers |
NIHORT |
| Var 6 | Green and shades of red and purple |
Yellow | Yellow | Oval | Few staminate and many hermaphrodite flowers |
NIHORT |
| Var 8 | Greyish brown | Yellow | Yellow | Oval | Few staminate and many hermaphrodite flowers |
NIHORT |
| Var 10 | Green and shades of red and purple |
Yellow | Yellow | Oval | Staminate flowers and a few hermaphrodite flowers |
NIHORT |
| Var 12 | Green and shades of red and purple |
Yellow | Yellow | Oval | Hermaphrodite flowers and a few pistillate flowers |
NIHORT |
| Var 13 | Green and shades of red and purple |
Yellow | Yellow | Oval | Staminate flowers and a few hermaphrodite flowers |
NIHORT |
| Var 15 | Green and shades of red and purple |
Yellowish green | Yellow | Oval | Hermaphrodite flowers only | NIHORT |
| Var 17 | Green and shades of red and purple |
Yellow | Yellow | Oval | Staminate flowers and a few hermaphrodite flowers |
NIHORT |
| Var 18 | Green and shades of red and purple |
Yellow | Yellow | Oval | Hermaphrodite flowers only | NIHORT |
| Var 19 | Green and shadesof red and purple | Yellowish green | Reddish orange | Oval | Hermaphrodite flowers only | NIHORT |
Data collection of agronomic traits, bioactive compounds, proximate and mineral compositions: Agronomic data were collected on the following parameters: Tree height (TH), tree diameter (TD), height to first fruit (HFF), number of nodes to first flower (NNFF), fruit weight (FWT), fruit width (FWDT), number of harvested fruits (NHF), and fruit length (FL). Tree height and diameter were measured at physiological maturity using a measuring tape and calipers, respectively. Height to first fruit and number of nodes to first flower were recorded for each plant at the onset of fruiting. Fruit length was determined as the distance from the peduncle attachment point to the blossom end, while fruit width was measured across the widest portion of each fruit. Additionally, the number of fruits produced per plant and their corresponding weights were recorded at maturity. The proximate composition of the pawpaw varieties was analyzed to determine the levels of major nutrients and components, including protein, moisture, ash, fibre, lipid, and carbohydrates. Mineral contents, which include potassium (K), sodium (Na), calcium (Ca), zinc (Zn), and iron (Fe), were determined via acid digestion using a hot plate method. Concentrations of Ca, Fe, and Zn were quantified using Atomic Absorption Spectroscopy (AAS), while Na and K were measured via flame emission photometry. The elemental concentrations were calculated based on absorbance calibration curves and expressed on a wet weight basis.
Vitamin C was determined photometrically. Total phenolic content was quantified using Folin-Ciocalteu reagent with absorbance measured at 650 nm, expressed as gallic acid equivalents. Flavonoid content was assessed by an aluminum chloride colorimetric assay with absorbance at 510 nm, reported as catechin equivalents. Lycopene and β-carotene were extracted using acetone-ethanol and petroleum ether partitioning, purified via alumina column, and quantified spectrophotometrically at specific wavelengths, calculated based on absorbance and standard coefficients. Pawpaw pH was measured using a calibrated pH meter, and total soluble solids (°Brix) were determined with a refractometer.
Additionally, pulp colour (L*, a*, b*) of the pawpaw varieties was analyzed using the CIE Lab* colour space system. Measurements included lightness (L*), representing the brightness of the pawpaw fruit on a scale from 0 (black) to 100 (white); the red-green axis (a*), with positive values indicating red and negative
values indicating green; and the yellow-blue axis (b*), where positive values correspond to yellow and negative to blue. These colour parameters were determined using a calibrated colorimeter, providing quantitative and standardized colour data for the pawpaw varieties. This method allows precise assessment of colour variations relevant to quality and visual attributes. All measurements were recorded in accordance with the Association of Official Analytical Chemists14 standard procedure to ensure accuracy and reproducibility. All analyses were done in triplicate for each representative fruit sample at the Product Development Laboratory of NIHORT.
Statistical data analyses: All agronomic and nutritional data were initially compiled in Microsoft Excel 2019 before statistical analysis. Statistical analyses were performed in R version 4.4.2 (R Core Team, 2024). Analysis of Variance (ANOVA) assessed significant differences among pawpaw varieties. When significant effects were detected, mean separation employed the Least Significant Difference (LSD) test at 0.05, 0.01, and 0.001 probability levels. Principal Component Analysis (PCA) reduced data dimensionality and identified key agronomic and nutritional traits contributing to variability; components with eigenvalues >1 were retained15. Pearson’s correlation coefficients were calculated using the “metan” package of Olivoto and Lucio16, to evaluate trait associations. Hierarchical clustering using Ward’s method grouped varieties by similarity in agronomic and nutritional traits, revealing patterns of diversity. Additionally, Genotype by Yield×Trait (GYT) biplot analysis was conducted in R to integrate multiple traits with fruit weight (yield), enabling multi-trait superiority ranking of pawpaw varieties13.
RESULTS
Variability among pawpaw varieties: Analysis of Variance (ANOVA) revealed significant differences (p<0.001) among pawpaw varieties for all agronomic traits, bioactive compounds, proximate and mineral compositions, except for tree height, tree diameter, height of first fruit, and fruit weight (Table 2). Most traits exhibited coefficients of variation (CV) below 20%, indicating good experimental precision and reliable data. The coefficient of determination (R2) ranged from 0.33 to 1.00, with nutritional parameters exhibiting high values (>0.90), indicating that these traits are predominantly under genetic control and less influenced by environmental factors. Moderate R2 values for some agronomic traits (tree height = 0.33, tree diameter = 0.35) indicate a stronger environmental effect. Fruit-related traits displayed moderate to high R2 values (0.40-0.89), reflecting varying degrees of genetic influence. These results highlight significant genetic variability among pawpaw varieties, with varying environmental contributions across different traits.
Variation was observed among the varieties for diverse traits (Table 3). Lycopene content showed the widest range, from 6.5 μg/100 g in Var 18 to 908.4 μg/100 g in Var 8. Fruit weight ranged from 0.4 kg (Var 1) to 5.5 kg (Var 10), while tree height and diameter varied from 1.1 m (Var 5) to 1.6 m (Var 4), and 15.3 cm (Var 6) to 22.3 cm (Var 2), respectively.
The height to first fruit ranged between 1.1 m and 6.1 m, and the number of nodes to first flower ranged from 17.7 to 36.7. Fruit width and length varied from 18.6 to 48.5 cm and 16.1 to 33.0 cm, respectively. The number of harvested fruits per plant ranged from 8.0 to 20.0.
Proximate analysis revealed protein (1.0-1.5/100 g), moisture (75.8-80.9/100 g), ash (0.6-0.8/100 g), fiber (1.6-2.8/100 g), lipid (0.1-0.2/100 g), and carbohydrates (15.4-37.6/100 g) across varieties. Color parameters varied in lightness (L*: 21.6-37.6), a* (8.8-17.8), and b* (14.7-35.4). Total soluble solids ranged between 3.9-10.1 °Brix, and pH from 6.0-6.8. Bioactive compounds (phytochemical contents) ranged for phenolics (94.4-220.0 mg/100 g), flavonoids (32.9-87.1 mg/100 g), β-carotene (6.3-445.6 μg/100 g), and vitamin C (60.0-62.5 mg/100 g). Varietal mineral content includes potassium (165.0-260.0 mg/100 g), calcium (24.9-70.0 mg/100 g), zinc (0.2-0.3 mg/100 g), iron (0.1-0.3 mg/100 g), and sodium (3.2-4.9 mg/100 g).
| Table 2: | Mean squares of agronomic traits, bioactive compounds, proximate and mineral compositions of pawpaw varieties evaluated | |||
| Source | |||||
| Trait | Variety (df = 12) | Rep (df = 2) | Error (df = 24) | CV (%) | R2 |
| Tree height (m) | 0.05 | 0.08 | 0.07 | 19.27 | 0.33 |
| Tree diameter (cm) | 13.39 | 124.09** | 13.6 | 19.03 | 0.56 |
| Height of first fruit (m) | 5.56 | 4.88 | 5.87 | 1.53 | 0.35 |
| Number of nodes to first flower | 110.9** | 10.53 | 27.21 | 19.48 | 0.67 |
| Fruit weight (kg) | 5.09 | 6.44 | 4.57 | 1.3 | 0.4 |
| Fruit width (cm) | 287.70*** | 56.75 | 18.01 | 12.69 | 0.89 |
| Number of harvested fruits | 33.45* | 25.54 | 11.35 | 28.77 | 0.62 |
| Fruit length (cm) | 57.50* | 72.47 | 22.64 | 19.01 | 0.61 |
| Protein (g/100 g) | 0.07*** | 0.00*** | 0 | 1.03 | 1 |
| Moisture (g/100 g) | 7.09*** | 0.24 | 0.32 | 0.71 | 0.92 |
| Ash (g/100 g) | 0.02*** | 0 | 0 | 2.01 | 0.98 |
| Fibre (g/100 g) | 0.34*** | 0 | 0 | 1.96 | 0.99 |
| Lipid (g/100 g) | 0.00*** | 0 | 0 | 4.77 | 0.95 |
| Carbohydrate (g/100 g) | 6.94*** | 0.25 | 0.3 | 3.22 | 0.92 |
| Colour L* | 96.82*** | 0.05 | 0.05 | 0.77 | 1 |
| Colour a* | 28.56*** | 0.06 | 0.12 | 3.01 | 0.99 |
| Colour b* | 134.84*** | 0.18 | 0.13 | 1.53 | 1 |
| Potassium (mg/100 g) | 2926.15*** | 1.31 | 1.12 | 0.49 | 1 |
| Sodium (mg/100 g) | 1.16*** | 0.01 | 0.01 | 2.23 | 0.99 |
| Calcium (mg/100 g) | 669.93*** | 1.51** | 0.18 | 1.1 | 1 |
| Zinc (mg/100 g) | 0.00*** | 0 | 0 | 0.67 | 1 |
| Iron (mg/100 g) | 0.02*** | 0 | 0 | 2.8 | 1 |
| pH | 0.15*** | 0 | 0 | 0.23 | 1 |
| Total soluble solids (°Brix) | 7.56*** | 0.06*** | 0 | 0.83 | 1 |
| Phenolic (mg/100 g) | 4539.44*** | 31.87 | 27.58 | 3.03 | 0.99 |
| Flavonoid (mg/100 g) | 848.88*** | 11.93 | 25.16 | 7.93 | 0.94 |
| Lycopene (μg/100 g) | 225180.52*** | 1.79 | 12.83 | 1.26 | 1 |
| ?-carotene (μg/100 g) | 61572.6*** | 8.3 | 7.27 | 2.64 | 0.9 |
| Vitamin C (mg/100 g) | 3.96*** | 0.02 | 0.23 | 0.79 | 1 |
| *,**,*** Significant at 0.05, 0.01, and 0.001 probability levels, respectively, R2: Coefficient of determination, CV: Coefficient of variation and df: Degree of freedom | |||||
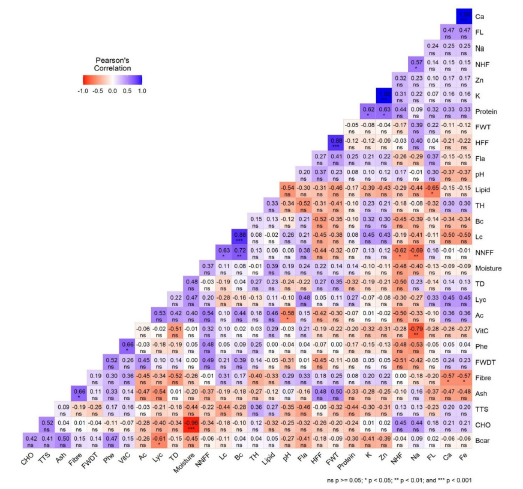
Multivariate analysis of pawpaw varieties: The correlogram (Fig. 1) depicts the strength and direction of linear relationships among pawpaw traits. Several highly significant correlations (p<0.001) were identified: Calcium and iron content showed a perfect positive correlation (r = 1.00), while potassium and zinc were nearly perfectly correlated (r = 0.99). Moisture content was strongly and negatively correlated with carbohydrate content (r = –0.96). Among fruit pulp colour parameters, L* and b* had a strong positive correlation (r = 0.88), and height to first fruit correlated positively with fruit weight (r = 0.88). At p<0.01, sodium content showed a strong negative correlation with vitamin C (r = 0.79). The number of nodes to first flower correlated negatively with sodium (r = -0.69) and positively with b* (r = -0.72). Several significant correlations (p<0.05) included: Ash content with fiber (r = 0.66), phenolics with vitamin C (r = 0.66), fruit length negatively with lipids (r = -0.65), and protein positively with potassium (r = 0.62) and zinc (r = 0.63). The number of nodes to first flower also correlated positively with L* (r = 0.63) and negatively with the number of harvested fruits (r = -0.62). Fiber content negatively correlated with calcium and iron (r = -0.57 each), while harvested fruit number correlated positively with sodium (r = 0.57). Additionally, color parameter a* was negatively correlated with pH (r = -0.58), and lycopene correlated negatively with β-carotene (r = -0.61).
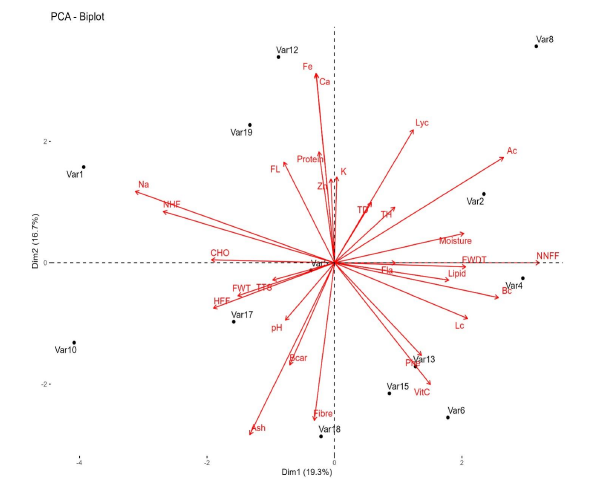
The principal component analysis (PCA) was conducted on agronomic traits, bioactive compounds, proximate and mineral compositions (Table 4). The first five principal components (PCs) with eigenvalues >1 explained approximately 74% of the total variation among pawpaw varieties: PC1 accounted for 19%,
|
PC2 for 17%, PC3 for 16%, PC4 for 14%, and PC5 for 9%. The PCA biplot (Fig. 2) illustrates the trait loadings on PC1 and PC2. Traits including number of nodes to first flower (NNFF), fruit pulp colour parameters (a*, b*), moisture content, fruit width (FWDT), and lipid content strongly and positively influenced PC1, as indicated by their vectors pointing in the same direction. Conversely, sodium (Na), number of harvested fruits (NHF), height to first fruit (HFF), fruit weight (FWT), and carbohydrate content (CHO) had strong negative loadings on PC1. PC2 was primarily influenced by calcium (Ca), iron (Fe), lycopene, protein content, and fruit length (FL).
The vector orientations and angles confirm correlations observed in Pearson’s analysis: calcium and iron vectors align perfectly, reflecting their perfect positive correlation (r = 1.00, p<0.001). Similarly, potassium (K) and zinc (Zn) cluster closely, indicating a near-perfect correlation. Opposing vectors of moisture and carbohydrate support their strong negative correlation (r = -0.96, p<0.001). Colour parameters L* and b* cluster closely, consistent with their strong positive correlation, while HFF and FWT vectors point similarly, validating their positive relationship. Negative correlations are suggested by sodium’s vector pointing oppositely to NNFF and colour parameters. Varietal positioning in the trait space highlights Var 8 as distinct for high lycopene and specific fruit pulp colour traits, Var 2 for high NNFF and selected quality traits, Var 12 for elevated iron and calcium content, and Var 4 for high NNFF and lipid content, all consistent with the correlation results.
|
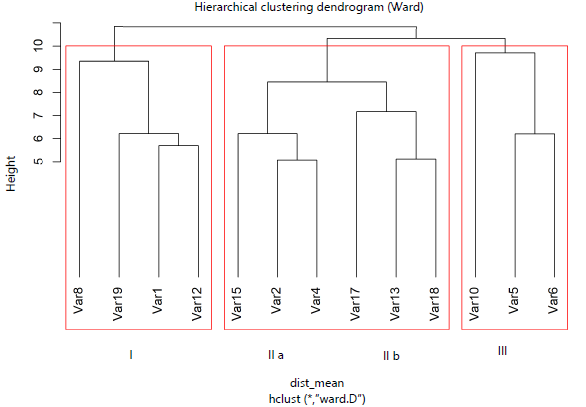
Hierarchical cluster analysis was performed using Ward’s method on the measured agronomic traits, bioactive compounds, proximate and mineral compositions, resulting in the identification of distinct groupings among the pawpaw varieties (Fig. 3). The resulting dendrogram classified the 13 varieties into three principal clusters. Cluster I comprised four varieties (Var 8, Var 19, Var 1, and Var 12). Cluster II contained six varieties, which were further resolved into two sub-clusters: IIa (Var 15, Var 2, Var 4) and IIb (Var 17, Var 13, Var 18). Cluster III consisted of three varieties (Var 10, Var 5, and Var 6). Each cluster represents sa set of pawpaw varieties exhibiting similar phenotypic profiles based on the assessed traits.
|
|
| Table 3: | Mean performance of agronomic traits, bioactive compounds, proximate and mineral compositions of pawpaw varieties evaluated | |||
| Trait | Var 1 | Var 2 | Var 4 | Var 5 | Var 6 | Var 8 | Var 10 | Var 12 | Var 13 | Var 15 | Var 17 | Var 18 | Var 19 | LSD -0.05 |
| Tree height (m) | 1.4 | 1.3 | 1.6 | 1.1 | 1.3 | 1.3 | 1.2 | 1.3 | 1.3 | 1.3 | 1.4 | 1.3 | 1.6 | 0.5 |
| Tree diameter (cm) | 16.4 | 22.3 | 20.8 | 17.1 | 15.3 | 19.9 | 21.2 | 20.5 | 20.4 | 20 | 20.6 | 17.5 | 20 | 6.2 |
| Height to first fruit (m) | 1.1 | 1.1 | 1.4 | 1 | 1.2 | 1.2 | 6.1 | 1.2 | 1.2 | 1.3 | 1.3 | 1.3 | 1.3 | 4.1 |
| Number of nodes to first flower |
20.5 | 33 | 31 | 25 | 34.3 | 36.7 | 17.7 | 22.8 | 22 | 33 | 24.2 | 25.8 | 22 | 8.8 |
| fruit weight (kg) | 0.4 | 1.5 | 0.9 | 1.9 | 1.1 | 2 | 5.5 | 1 | 1.1 | 1 | 2.8 | 1.1 | 1.1 | 3.6 |
| Fruit width (cm) | 19.2 | 39 | 26.9 | 32.1 | 40.5 | 45.6 | 18.6 | 23.4 | 41.5 | 33.9 | 48.5 | 27.4 | 38.3 | 7.2 |
| Number of harvested fruits |
20 | 9.8 | 8.5 | 15.7 | 10.2 | 8 | 11.7 | 12.3 | 10.3 | 9.5 | 9.8 | 11.7 | 14.7 | 5.7 |
| Fuit length (cm) | 27.5 | 21.9 | 20.3 | 28.3 | 23.3 | 33 | 26 | 28.3 | 16.1 | 27.8 | 27.5 | 22.9 | 22.6 | 8 |
| Protein (g/100 g) | 1.2 | 1.1 | 1.2 | 1.5 | 1.2 | 1.3 | 1.2 | 1.2 | 1 | 1 | 1 | 1.2 | 1.4 | 0 |
| Moisture (g/100 g) | 76.4 | 80.1 | 80.4 | 79.1 | 77.7 | 80.9 | 80 | 78.4 | 79.7 | 79.9 | 75.8 | 78.6 | 79.1 | 1 |
| Ash (g/100 g) | 0.7 | 0.7 | 0.7 | 0.7 | 0.8 | 0.6 | 0.8 | 0.6 | 0.8 | 0.7 | 0.8 | 0.8 | 0.8 | 0 |
| Fibre (g/100 g) | 1.7 | 1.9 | 1.7 | 2.4 | 2.8 | 1.6 | 2.3 | 1.7 | 2.1 | 2 | 2.2 | 2.2 | 2 | 0 |
| Lipid (g/100 g) | 0.2 | 0.2 | 0.2 | 0.2 | 0.2 | 0.2 | 0.1 | 0.2 | 0.2 | 0.2 | 0.1 | 0.2 | 0.2 | 0 |
| Carbohydrate(g/100 g) | 19.9 | 16 | 15.8 | 16.1 | 17.4 | 15.4 | 15.6 | 17.9 | 16.2 | 16.2 | 20 | 17 | 16.5 | 0.9 |
| colour L* | 26.1 | 36.7 | 36.1 | 37.6 | 37.1 | 25.7 | 21.6 | 26.3 | 25.3 | 35.8 | 28.2 | 26.9 | 26.8 | 0.4 |
| colour a* | 8.8 | 17.8 | 12.1 | 8.8 | 11 | 16.5 | 7.4 | 14 | 13.5 | 9.4 | 10.3 | 11.2 | 10.7 | 0.6 |
| colour b* | 14.7 | 35.4 | 29.1 | 26.2 | 30.5 | 20.3 | 11.6 | 22.7 | 17.7 | 26.7 | 25.3 | 22.4 | 17.8 | 0.6 |
| Potassium (mg/100 g) | 225 | 245 | 227 | 247.6 | 252.2 | 205 | 204.3 | 210 | 165 | 180 | 205 | 170 | 260 | 1.8 |
| Sodium (mg/100 g) | 4.8 | 4.4 | 3.4 | 4 | 3.2 | 3.3 | 4.9 | 4.5 | 3.3 | 3.7 | 4.6 | 3.8 | 4.6 | 0.2 |
| Calcium (mg/100 g) | 50 | 35 | 27.1 | 24.9 | 26 | 70 | 28.2 | 50 | 30 | 25 | 45 | 30 | 60 | 0.7 |
| Zinc (mg/100 g) | 0.3 | 0.3 | 0.3 | 0.3 | 0.3 | 0.2 | 0.2 | 0.2 | 0.2 | 0.2 | 0.2 | 0.2 | 0.3 | 0 |
| Iron (mg/100 g) | 0.2 | 0.2 | 0.1 | 0.1 | 0.1 | 0.3 | 0.1 | 0.2 | 0.1 | 0.1 | 0.2 | 0.1 | 0.3 | 0 |
| pH | 6.4 | 6.1 | 6.2 | 6.5 | 6.4 | 6.2 | 6.6 | 6.1 | 6.1 | 6.8 | 6 | 6 | 6.2 | 0 |
| Total soluble solids (Brix) | 10.1 | 6.9 | 7.9 | 3.9 | 8.7 | 6.9 | 7.4 | 9.1 | 8.2 | 7.5 | 8.1 | 10.1 | 8.4 | 0 |
| Phenolic (mg/100 g) | 138.9 | 140 | 186.7 | 131.1 | 220 | 220 | 158.9 | 94.4 | 164.4 | 191.1 | 200 | 214.4 | 191.1 | 8.9 |
| Flavonoid (mg/100 g) | 51.1 | 67.8 | 62.7 | 82.5 | 86.2 | 87.1 | 80 | 62.7 | 49.3 | 47.1 | 54.7 | 57.8 | 32.9 | 8.5 |
| Lycopene (μg/100 g) | 50.1 | 191.4 | 235.5 | 272.4 | 267.7 | 908.4 | 342 | 738.2 | 435.7 | 80.7 | 6.5 | 6.5 | 154.5 | 6 |
| β-carotene (μg/100 g) | 80.5 | 21.8 | 16.6 | 15 | 43.5 | 8.6 | 6.3 | 8.6 | 9.6 | 205.9 | 339.9 | 445.6 | 125.6 | 4.5 |
| Vitamin C (mg/100 g) | 60.7 | 59.1 | 61.7 | 60.5 | 62.5 | 61.6 | 59.9 | 59 | 62.2 | 60.5 | 60.6 | 61.9 | 59.6 | 0.8 |
| Var: Variety | ||||||||||||||
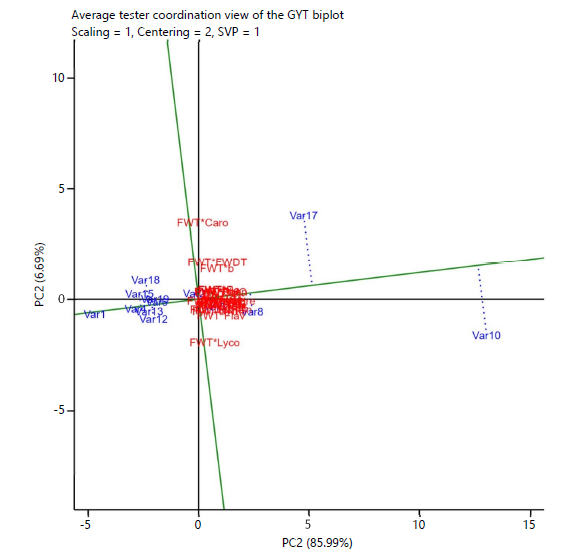
Genotype by Yield×Trait (GYT) analysis was performed to integrate fruit weight with multiple agronomic and nutritional parameters, enabling comprehensive ranking of pawpaw varieties based on their combined performance for yield and quality. Standardized GYT values (Supplementary Table 1) facilitated simultaneous evaluation of yield in relation to associated traits. Three varieties Var 10 (SI = 2.51), Var 17 (SI = 1.03), and Var 8 (SI = 0.49), were identified as superior based on their superiority indices (SI), with Var 10 exhibiting balanced excellence across all measured traits. Variety 17 and Variety 8 distinguished themselves with strong performance in vitamin C, sodium, potassium, and antioxidant compounds. In contrast, Var 1 (SI = -0.94), Var 4 (SI = -0.58), and Var 15 (SI = -0.52) consistently ranked lowest, exhibiting negative standardized values in most yield-related and nutritional categories. The GYT biplot (Figure 4) visually depicts the top-performing varieties positioned at the far right, while the least performers appear at the far left of the distribution plane.
DISCUSSION
Pawpaw breeding programs hold substantial promise for concurrently elevating yield potential and nutritional profiles through strategic variety selection. Multivariate analyses of agronomic traits alongside nutritional parameters enable precise identification of superior varieties and optimal trait associations. This approach underpins targeted genetic enhancement, leveraging existing variability to advance varieties suited to local agroecologies while bolstering food security and market value17.
| Table 4: | Principal component analysis of the contributions of agronomic traits, bioactive compounds, proximate and mineral compositions to total variation among the pawpaw varieties evaluated | |||
| Principal components | |||||
| Traits | PC1 | PC2 | PC3 | PC4 | PC5 |
| Tree height (m) | 0.11 | 0.11 | 0.23 | 0.13 | 0.15 |
| Tree diameter (cm) | 0.07 | 0.12 | 0.08 | -0.32 | 0.21 |
| Height to first fruit (m) | -0.21 | -0.09 | -0.16 | -0.33 | -0.02 |
| Number of nodes to first flower | 0.36 | 0 | -0.07 | 0.09 | -0.15 |
| Fruit weight (kg) | -0.17 | -0.07 | -0.2 | -0.3 | -0.15 |
| Fruit width (cm) | 0.23 | -0.01 | 0.06 | 0.08 | -0.27 |
| Number of harvested fruits | -0.3 | 0.1 | -0.04 | 0.22 | 0.11 |
| Fruit length (cm) | -0.09 | 0.2 | -0.15 | 0.02 | -0.36 |
| Protein content (g/100 g) | -0.03 | 0.22 | -0.23 | 0.14 | -0.03 |
| Moisture content (g/100 g) | 0.23 | 0.06 | -0.13 | -0.32 | 0.14 |
| Ash content (g/100 g) | -0.15 | -0.34 | 0.02 | -0.09 | -0.06 |
| Fibre content (g/100 g) | -0.04 | -0.31 | -0.21 | 0.14 | -0.13 |
| Lipid content (g/100 g) | 0.2 | -0.03 | 0.25 | -0.12 | 0.27 |
| Carbohydrate content (g/100 g) | -0.22 | 0.01 | 0.2 | 0.28 | -0.11 |
| Colour L* (Lightness) | 0.23 | -0.11 | -0.2 | 0.27 | 0.2 |
| Colour a* (Red-Green Axis) | 0.3 | 0.21 | 0.1 | -0.08 | 0.03 |
| Colour b* (Yellow-Blue Axis) | 0.29 | -0.07 | -0.08 | 0.21 | 0.15 |
| Potassium (mg/100 g) | 0 | 0.17 | -0.25 | 0.29 | 0.12 |
| Sodium (mg/100 g) | -0.35 | 0.14 | 0 | 0 | 0.13 |
| Calcium (mg/100 g) | -0.03 | 0.38 | 0.14 | 0.02 | -0.26 |
| Zinc (mg/100 g) | -0.01 | 0.17 | -0.26 | 0.29 | 0.09 |
| Iron (mg/100 g) | -0.03 | 0.38 | 0.14 | 0.02 | -0.26 |
| pH | -0.09 | -0.11 | -0.3 | -0.02 | -0.01 |
| Total soluble solids (°Brix) | -0.11 | -0.03 | 0.35 | 0.06 | -0.03 |
| Phenolic content (mg/100 g) | 0.15 | -0.18 | 0.09 | 0.04 | -0.38 |
| Flavonoid content (mg/100 g) | 0.11 | 0 | -0.32 | -0.08 | -0.23 |
| Lycopene (μg/100 g) | 0.14 | 0.27 | -0.08 | -0.24 | -0.17 |
| β-Carotene (μg/100 g) | -0.08 | -0.2 | 0.25 | 0.12 | -0.17 |
| Vitamin C (mg/100 g) | 0.17 | -0.24 | 0.08 | 0.04 | -0.25 |
| Eigenvalue | 5.59 | 4.84 | 4.61 | 3.92 | 2.61 |
| Proportion (%) | 19 | 17 | 16 | 14 | 9 |
| Cumulative (%) | 19 | 36 | 52 | 65 | 74 |
| PC: Principal component and values in bold made substantial contributions to the total variation | |||||
Significant variation in performance was observed among the thirteen pawpaw varieties evaluated under identical environmental conditions. The variations detected across most measured traits align with the findings of Nwofia and Okwu18, confirming considerable genetic and phenotypic diversity among pawpaw germplasm. Asudi et al.19 reported significant morphological variation among different papaya lines. da Silva et al.20 and Brewer et al.21 also reported growth diversity in pawpaw accessions, attributed to genetic and environmental factors. Additionally, Aikpokpodion22 observed variation in growth and yield traits among Nigerian pawpaw accessions. Also, significant differences were observed among the pawpaw varieties for fruit pulp colour. However, these results are largely descriptive, reflecting inherent variation in skin and pulp pigmentation, as some varieties naturally possess lighter or more yellow tissues than others. These results are in strong agreement with the report of Brannan et al.23. The observed variability among the pawpaw varieties highlights the feasibility of selecting superior genotypes for fruit yield and nutritional traits, thereby enabling targeted improvement. Thus, the observed phenotypic diversity in this study is attributable to underlying genetic differences, consistent with previous reports, and can be harnessed to develop improved varieties exhibiting desirable horticultural characteristics24. Notably, this study further revealed an association between tree size and fruit production, as evidenced by Var 5, which, despite a shorter height (1.13 m), produced among the highest fruit numbers (15.67).
Significant differences in nutritional trait performance among pawpaw varieties suggest that they can be strategically utilized to enhance the genetic potential of pawpaw, thereby increasing profitability. Nutrient (proximate) analysis from the current study indicated less lipid and ash but more moisture, carbohydrate, fibre, and protein. Notably, some varieties demonstrated excellence across multiple traits; for instance, Var 8 was outstanding in lycopene content and fruit length, alongside Var 10, Var 18, and Var 19. Var10, with the highest fruit weight, possessed a substantial yield advantage, while Var 17 combined high fruit weight with a desirable nutritional profile. These varieties, therefore, offer promising potential to meet demands for improved fruit yield and quality. Similar results were reported by Brannan et al.23 and Adinde et al.8, who evaluated the growth, yield, and nutritional characteristics of pawpaw varieties.
Carotenoids, vitamins, and antioxidants present in pawpaw fruits are of considerable nutritional value, conferring health benefits to consumers2. The observed variation in bioactive compounds, proximate and mineral compositions among the varieties may result from genetic differences, environmental influences, or the stage of ripeness at harvest. Lycopene content in the evaluated pawpaw varieties exceeded that of β-carotene, supporting the predominance of lycopene over β-carotene in the red pulp of pawpaw fruits25. According to Shen et al.26, lycopene is the predominant carotenoid in the red pulp of pawpaw fruit, whereas β-carotene and β-cryptoxanthin are the major carotenoids in the yellow pulp. The high total soluble solid content in the studied varieties underscores their suitability for processed product preparation11. Moreover, all evaluated varieties had fruit juice pH values below 6.8, indicating their appropriateness for fresh consumption and industrial processing.
The principal component correlation matrix identified key traits responsible for variation among the pawpaw varieties. The most influential contributors to variation in this study include the number of nodes to first flower, fruit weight, tree height and diameter, lycopene, vitamin C, and β-carotene contents. These traits were primarily associated with the first and second principal components (PC1 and PC2). These highly discriminating traits are recommended as descriptors for the phenotypic characterization of pawpaw germplasm. Previous research has similarly demonstrated that fruit quality traits are major contributors to variation among pawpaw varieties27.
The Ward’s hierarchical clustering dendrogram indicates clear phenotypic divergence among the three groups formed. The first cluster grouped Var 8, Var 19, Var 1, and Var 12, suggesting close similarity for the traits analyzed and potential redundancy if all are retained as parents. The second cluster comprised Var 15, Var 2, Var 4, Var 17, Var 13, and Var 18, reflecting a broader but related set of varieties that may share intermediate performance profiles. Var 10, Var 5, and Var 6 formed a distinct cluster, implying that these varieties differ substantially from the others and may harbor unique trait combinations valuable for broadening the genetic base in breeding programmes. These findings suggest that simultaneous improvement of fruit yield and quality could be achieved by selecting promising parental lines from the three clusters I, supporting targeted breeding strategies for pawpaw improvement28.
Correlation analysis is essential for both direct and indirect selection in genetic improvement programs. In this study, correlation coefficients among traits spanned weak to strong positive and negative values. The strongest positive and statistically significant correlations were observed between calcium and iron contents, followed by potassium and zinc, both exhibiting similar strength and direction. Conversely, moisture content showed a significant negative correlation with carbohydrate content but a positive correlation with fruit weight. Strong correlations among traits reflect the potential for selecting favorable combinations of these traits in specific varieties to enhance breeding efficiency29. These inter-trait correlations can streamline breeding efforts by utilizing easily measurable traits as proxies for more complex ones, thereby accelerating selection processes30.
The GYT biplot approach enhances varietal evaluation by integrating yield with multiple agronomic and nutritional traits, providing a more holistic assessment than traditional indices or PCA, which often consider traits independently. The GYT method emphasizes balanced performance across trait combinations, making it particularly advantageous for crops like pawpaw, where both productivity and fruit quality are critical breeding objectives. As noted by Yan and Frégeau-Reid13, this approach improves selection efficiency by aligning variety rankings with practical breeding goals, facilitating the identification of superior varieties with simultaneous gains in multiple traits31.
CONCLUSION
This study highlights significant phenotypic and nutritional variability among pawpaw varieties, underscoring the potential for targeted genetic improvement. Cluster and multivariate analyses identified key traits and superior varieties that can serve as promising parental lines. The GYT approach effectively integrated complex trait data to prioritize varieties with balanced productivity and quality, enhancing selection efficiency. Var 10, Var 17, and Var 8 were identified as top-ranked performers based on the SI. The strong correlations among certain easily measurable traits offer practical pathways to accelerate breeding progress. Collectively, these findings provide a robust framework to guide future pawpaw breeding programs aimed at developing high-yielding, nutrient-rich cultivars to meet both market and consumer demands.
SIGNIFICANCE STATEMENT
This study provides significant insights into phenotypic and nutritional diversity among pawpaw (Carica papaya L.) varieties, enabling efficient identification of superior genotypes for breeding programs. Findings enhance understanding of trait associations, support targeted selection, and promote development of high-yielding, nutrient-rich cultivars. The results contribute to improved genetic resource utilization, sustainable production systems, and meeting increasing nutritional and market demands globally.
REFERENCES
- Santos, E.M., Í.H.L. Cavalcante, G.B. da Silva Jr. and F.G. Albano, 2015. Impact of nitrogen and potassium nutrition on papaya (pawpaw) fruit quality. Biosci. J., 31: 1341-1348.
- Daagema, A.A., P.N. Orafa, F.Z. Igbua, 2020. Nutritional potentials and uses of pawpaw (Carica papaya): A review. Eur. J. Nutr. Food Saf., 12: 52-66.
- Kadiri, O., B. Olawoye, O.S. Fawale and O.A. Adalumo, 2016. Nutraceutical and antioxidant properties of the seeds, leaves and fruits of Carica papaya: Potential relevance to humans diet, the food industry and the pharmaceutical industry-A review. Turk. J. Agric. Food Sci. Technol., 4: 1039-1052.
- Kayode, R.M.O., V.A. Joshua and M.O. Oyetoro, 2023. Effects of drying methods on nutrients and organoleptic properties of dried pawpaw chips. Croatian J. Food Sci. Technol., 15: 8-15.
- Grygorieva, O., S. Klymenko, O. Vergun, K. Fatrcová-Šramková and O. Shelepova et al., 2021. Studies of the chemical composition of fruits and seeds of pawpaw (Asimina triloba (L.) Dunal). Agrobiodiversity Improving Nutr. Health Life Qual., 5: 26-36.
- Park, S.Y., H.L. Jang and J.S. Nam, 2022. Comparison of nutritional compositions and physicochemical properties of unripe and ripe pawpaw (Asimina triloba [L.] Dunal) fruits grown in Korea. J. Korean Soc. Food Sci. Nutr., 51: 933-941.
- Adepoju, O.T. and A.A. Daagema, 2021. Evaluation of nutrient content and acceptability of pawpaw (Carica papaya) soups consumed by Tiv people of Benue State, Nigeria. Int. J. Sci., 10: 1-10.
- Adinde, J.O., O. Ugwuanyi-Nnadi, O.J. Uche and U.J. Anieke, 2024. Evaluation and selection of pawpaw accessions for production and breeding programmes in Southeast Nigeria using Rank Summation Index (RSI) approach. J. Agric. Sci. Pract., 9: 157-164.
- Peterson, R.N., 2003. Pawpaw variety development: A history and future prospects. HortTechnology, 13: 449-454.
- Adainoo, B., A.L. Thomas and K. Krishnaswamy, 2023. A comparative study of edible coatings and freshness paper on the quality of fresh North American pawpaw (Asimina triloba) fruits using TOPSIS-Shannon entropy analyses. Curr. Res. Food Sci., 7.
- Adainoo, B., P. Byers, K. Krishnaswamy, D. Redhage and K. Hunt et al., 2024. Long-term performance of ten North American pawpaw cultivars in Missouri, USA. Int. J. Fruit Sci., 24: 229-241.
- Olubode, O.O., O.M. Odeyemi and I.O.O. Aiyelaagbe, 2016. Influence of environmental factors and production practices on the growth and productivity of pawpaw (Carica papaya L.) in South Western Nigeria-A review. Fruits, 71: 341-361.
- Yan, W. and J. Frégeau-Reid, 2018. Genotype by Yield*Trait (GYT) biplot: A novel approach for genotype selection based on multiple traits. Sci. Rep., 8.
- AOAC., 1995. Official Methods of Analysis of AOAC International. 16th Edn., AOAC International, Rockville, Maryland, USA.
- Jeffer, J.N.R., 1967. Two case studies in the application of principal component analysis. J. R. Stat. Soc. Ser. C (Appl. Stat.), 16: 225-236.
- Olivoto, T. and A.D.C. Lúcio, 2020. metan: An R package for multi-environment trial analysis. Methods Ecol. E, 11: 783-789.
- Lu, L., K.W. Pomper, J.D. Lowe and S.B. Crabtree, 2011. Genetic variation in pawpaw cultivars using microsatellite analysis. J. Am. Soc. Hortic. Sci., 136: 415-421.
- G.E. Nwofia, Q.U. Okwu, 2012. Studies on nutritive characteristics and variability in pawpaw (Carica papaya L.). Pak. J. Nutr., 11: 957-962.
- Asudi, G.O., F.K. Ombwara, F.K. Rimberia, E.M. Ateka, A.B. Nyende and L.S. Wamocho, 2013. Evaluating diversity among Kenyan papaya germplasm using simple sequence repeat markers. Afr. J. Food Agric. Nutr. Dev., 13: 7307-7324.
- da Silva, C.A., A.L. Nascimento, J.P. Ferreira, O. Schmildt and R.G. Malikouski et al., 2017. Genetic diversity among papaya accessions. Afr. J. Agric. Res., 12: 2041-2048.
- Brewer, S., A. Plotto, J. Bai, J. Crane and A. Chambers, 2021. Evaluation of 21 papaya (Carica papaya L.) accessions in Southern Florida for fruit quality, aroma, plant height, and yield components. Sci. Hortic., 288.
- Aikpokpodion, P.O., 2012. Assessment of genetic diversity in horticultural and morphological traits among papaya (Carica papaya) accessions in Nigeria. Fruits, 67: 173-187.
- Brannan, R.G., E.E. Anderson, R.L. Powell and M.C. Coyle, 2021. A comparative analysis of pawpaw (Asimina triloba) quality and nutritional data. J. Appl. Bot. Food Qual., 94: 121-131.
- Minuye, M. and M. Zerihune, 2020. Variability of physio-chemical, anti-oxidant, and sensorial quality of newly released papaya varieties in Ethiopia. J. Food Sci. Nutr. Ther., 6: 015-021.
- Rayhan, M., B. Mumtaz, M. Motalab, M.A. Zubair, M.Z. Haque and B.K. Saha, 2019. Extraction and quantification of lycopene, β-carotene and total phenolic contents from papaya (Carica papaya) and formulation of lycopene enriched fruit drinks. Am. J. Food Nutr., 7: 55-63.
- Shen, Y.H., F.Y. Yang, B.G. Lu, W.W. Zhao and T. Jiang et al., 2019. Exploring the differential mechanisms of carotenoid biosynthesis in the yellow peel and red flesh of papaya. BMC Genomics, 20.
- Nuwamanya, E., O. Ampurire, Y. Mukasa, A. Katungisa, M. Kanaabi and E.S. Mukiibi, 2020. Phenotypic diversity and chemical properties of pawpaw fruit quality in Ugandan germplasm. Afr. Crop Sci. J., 28: 499-515.
- Pomper, K.W., J.D. Lowe, L. Lu, S.B. Crabtree, S. Dutta, K. Schneider and J. Tidwell, 2010. Characterization and identification of pawpaw cultivars and advanced selections by simple sequence repeat markers. J. Am. Soc. Hortic. Sci., 135: 143-149.
- Kaur, K. and A. Kaur, 2017. Papaya performance under various growing conditions cv. Red Lady 786. Agric. Sci. Digest, 37: 290-293.
- Santana, J.G.S., H.C.C. Ramos, R. Santa-Catarina, J.C.F. Vettorazzi and D.P. Miranda et al., 2023. Exploring genetic diversity in inbred papaya lines for fruit quality in advanced stage of improvement. Sci. Rep., 13.
- Mohammadi, R., 2019. Genotype by yield*trait biplot for genotype evaluation and trait profiles in durum wheat. Cereal Res. Commun., 47: 541-551.
| Supplementary Table 1: | Standardized genotype by yield × trait data and superiority index of the evaluated pawpaw varieties | |||
| Variety | FWT* NHF |
FWT* Protein |
FWT* CHO |
FWT*K | FWT* Na |
FWT* Ca |
FWT* Fe |
FWT* TTS |
FWT* Phen |
FWT* Flav |
FWT* Lyco |
FWT* Caro |
FWT* Vit C |
| Var 10 | 3.01 | 2.91 | 2.78 | 2.89 | 3.03 | 2.01 | 2.01 | 2.97 | 2.69 | 2.99 | 2.19 | -0.44 | 2.95 |
| Var 17 | 0.57 | 0.59 | 1.34 | 0.81 | 0.88 | 1.36 | 1.35 | 1.04 | 1.23 | 0.36 | -0.77 | 2.93 | 0.87 |
| Var 8 | -0.18 | 0.41 | 0.13 | 0.19 | -0.07 | 1.63 | 1.64 | 0.12 | 0.67 | 0.54 | 2.03 | -0.5 | 0.27 |
| Var 5 | 0.7 | 0.59 | 0.12 | 0.41 | 0.08 | -0.32 | -0.31 | -0.54 | -0.18 | 0.38 | 0.01 | -0.46 | 0.17 |
| Var 2 | -0.23 | -0.16 | -0.14 | 0.09 | -0.04 | -0.17 | -0.17 | -0.19 | -0.32 | -0.08 | -0.33 | -0.44 | -0.12 |
| Var 6 | -0.46 | -0.4 | -0.37 | -0.24 | -0.5 | -0.68 | -0.69 | -0.27 | -0.16 | -0.13 | -0.31 | -0.38 | -0.37 |
| Var 19 | -0.18 | -0.27 | -0.46 | -0.26 | -0.3 | 0.07 | 0.08 | -0.35 | -0.36 | -0.7 | -0.53 | -0.06 | -0.45 |
| Var 12 | -0.37 | -0.44 | -0.42 | -0.49 | -0.34 | -0.2 | -0.2 | -0.31 | -0.85 | -0.43 | 0.42 | -0.53 | -0.49 |
| Var 18 | -0.41 | -0.49 | -0.45 | -0.64 | -0.44 | -0.64 | -0.65 | -0.19 | -0.27 | -0.47 | -0.78 | 1.17 | -0.44 |
| Var 13 | -0.46 | -0.54 | -0.45 | -0.62 | -0.49 | -0.6 | -0.6 | -0.34 | -0.46 | -0.52 | -0.03 | -0.52 | -0.39 |
| Var 15 | -0.6 | -0.63 | -0.54 | -0.64 | -0.49 | -0.79 | -0.79 | -0.52 | -0.43 | -0.6 | -0.67 | 0.19 | -0.51 |
| Var 4 | -0.7 | -0.59 | -0.61 | -0.53 | -0.57 | -0.78 | -0.78 | -0.54 | -0.51 | -0.5 | -0.45 | -0.51 | -0.55 |
| Var 1 | -0.68 | -0.98 | -0.92 | -0.97 | -0.75 | -0.88 | -0.89 | -0.87 | -1.04 | -0.83 | -0.76 | -0.44 | -0.96 |
| Variety | FWT* FWDT |
FWT*FL FL |
FWT*L | FWT*a | FWT*b | FWT/ NNFF |
FWT/ Moist |
FWT/ Ash |
FWT/ Fibre |
FWT/ Lipid |
FWT/ Zn |
FWT/ pH |
Superiority Index |
| Var 10 | 1.36 | 2.82 | 2.52 | 2.1 | 1.5 | 3.16 | 2.93 | 2.83 | 2.86 | 2.96 | 2.97 | 2.89 | 2.51 |
| Var 17 | 2.26 | 0.94 | 1.1 | 0.99 | 1.84 | 0.6 | 0.96 | 0.8 | 0.83 | 0.97 | 0.88 | 1 | 1.03 |
| Var 8 | 1 | 0.62 | 0.13 | 1.34 | 0.25 | -0.2 | 0.21 | 0.65 | 0.7 | 0.15 | 0.27 | 0.28 | 0.49 |
| Var 5 | 0.17 | 0.29 | 0.81 | -0.15 | 0.72 | 0.07 | 0.17 | 0.29 | -0.04 | 0.19 | -0.05 | 0.13 | 0.13 |
| Var 2 | 0.16 | -0.25 | 0.32 | 0.85 | 0.99 | -0.3 | -0.11 | -0.03 | 0.02 | -0.2 | -0.24 | -0.05 | -0.05 |
| Var 6 | -0.22 | -0.44 | -0.16 | -0.52 | -0.03 | -0.47 | -0.38 | -0.47 | -0.68 | -0.27 | -0.52 | -0.42 | -0.38 |
| Var 19 | -0.35 | -0.5 | -0.62 | -0.61 | -0.83 | -0.26 | -0.44 | -0.5 | -0.45 | -0.41 | -0.58 | -0.44 | -0.39 |
| Var 12 | -0.82 | -0.36 | -0.68 | -0.32 | -0.61 | -0.31 | -0.46 | -0.35 | -0.3 | -0.49 | -0.44 | -0.45 | -0.41 |
| Var 18 | -0.7 | -0.51 | -0.65 | -0.59 | -0.61 | -0.37 | -0.45 | -0.6 | -0.54 | -0.56 | -0.26 | -0.43 | -0.44 |
| Var 13 | -0.21 | -0.68 | -0.65 | -0.28 | -0.81 | -0.24 | -0.42 | -0.5 | -0.45 | -0.54 | -0.15 | -0.39 | -0.45 |
| Var 15 | -0.56 | -0.41 | -0.39 | -0.82 | -0.45 | -0.51 | -0.51 | -0.57 | -0.52 | -0.41 | -0.36 | -0.57 | -0.52 |
| Var 4 | -0.81 | -0.66 | -0.47 | -0.64 | -0.43 | -0.51 | -0.57 | -0.51 | -0.46 | -0.62 | -0.58 | -0.56 | -0.58 |
| Var 1 | -1.28 | -0.87 | -1.26 | -1.35 | -1.53 | -0.64 | -0.94 | -1.03 | -0.97 | -0.77 | -0.95 | -0.99 | -0.94 |
| FWT: Fruit weight, NHF: Number of nodes to first flower, CHO: Carbohydrate content, K: Potassium, Na: Sodium, Ca: calcium, Fe: Iron, TTS: Total soluble solids, Phen: Total phenolics, Flav: Total flavonoids, Lyco: Lycopene, Caro: β-carotene, VitC: Vitamin C, FWDT: Fruit width, FL: Fruit length, L, a, b: Fruit color coordinates, NNFF: Number of nodes to first flower, Moist: Fruit moisture content, Ash: Ash content, Fibre: Dietary fiber, Lipid: Fat content, Zn : zinc and pH: Fruit ph | |||||||||||||
How to Cite this paper?
APA-7 Style
Olayinka,
A.O., Ibitoye,
D.O., Olayinka,
A.F., Akande,
O.S., Adebayo,
P.A., Ujah,
G.O., Fatoki,
O.O. (2026). Multivariate Analysis of Agronomic and Nutritional Traits in Diverse Pawpaw (Carica papaya L.) Varieties. Trends in Agricultural Sciences, 5(2), 9-22. https://doi.org/10.21124/tas.2026.09.22
ACS Style
Olayinka,
A.O.; Ibitoye,
D.O.; Olayinka,
A.F.; Akande,
O.S.; Adebayo,
P.A.; Ujah,
G.O.; Fatoki,
O.O. Multivariate Analysis of Agronomic and Nutritional Traits in Diverse Pawpaw (Carica papaya L.) Varieties. Trends Agric. Sci 2026, 5, 9-22. https://doi.org/10.21124/tas.2026.09.22
AMA Style
Olayinka
AO, Ibitoye
DO, Olayinka
AF, Akande
OS, Adebayo
PA, Ujah
GO, Fatoki
OO. Multivariate Analysis of Agronomic and Nutritional Traits in Diverse Pawpaw (Carica papaya L.) Varieties. Trends in Agricultural Sciences. 2026; 5(2): 9-22. https://doi.org/10.21124/tas.2026.09.22
Chicago/Turabian Style
Olayinka, Adesike, O., Dorcas O. Ibitoye, Abiodun F. Olayinka, Olufemi S. Akande, Peter A. Adebayo, Godswill O. Ujah, and Oluwakemi O. Fatoki.
2026. "Multivariate Analysis of Agronomic and Nutritional Traits in Diverse Pawpaw (Carica papaya L.) Varieties" Trends in Agricultural Sciences 5, no. 2: 9-22. https://doi.org/10.21124/tas.2026.09.22

This work is licensed under a Creative Commons Attribution 4.0 International License.