Strawberry Calyx and its Impact on Fish Production Performance
-
Raky Fakhry Attalla


National Institute of Oceanography and Fisheries, Fish Nutrition Laboratory, Aquaculture Division, Cairo, Egypt
Susan Hassan FaddaNational Institute of Oceanography and Fisheries, Fish Nutrition Laboratory, Aquaculture Division, Cairo, Egypt
| Received 12 Jul, 2022 |
Accepted 28 Sep, 2022 |
Published 31 Mar, 2023 |
Background and Objective: The plant wastes (inedible parts) contain many functional and nutraceutical compounds and are a rich source of bioactive components and fiber. These by-products have a bad effect on the environment. This study was conducted to evaluate the nutritional value of Strawberry Calyces (SC) when added as an additive to the tilapia diet and to investigate its effect on growth performance, feed utilization and the physiological status of fish. Materials and Methods: A 70 days nutritional experiment was done on four groups of tilapia fry with an initial weight of 1.53±0.02 g, which were fed on test diets (40.03% protein, 399.61 kcal) as control (0%), SC1 (1%), SC2 (2%) and SC3 (3%) of strawberry calyces. Results: The results cleared those strawberry byproducts, rich in nutritional values with a high percentage of dry matter which consists of main components such as phenolics, vitamins, minerals and considerable amounts of fatty and amino acids, that are promising when used as feed additives. Growth performance (weight gain, specific growth rate and length gain) was improved by increasing the level of additive up to 3%, compared to control. Also, feed utilization and body composition were enhanced for the fish. At the same trend, the immune response (IgM and IgD) was improved for the three examined fish groups especially cleared in those fed SC2 and SC3. Conclusion: This article hopes to be applied to the other plant residues and extend such studies to the use of many different plant residues that pollute the environment if left and study the impact of their use in feeding aquatic animals at various levels.
| Copyright © 2023 Attalla and Fadda. This is an open-access article distributed under the Creative Commons Attribution License, which permits unrestricted use, distribution, and reproduction in any medium, provided the original work is properly cited. |
INTRODUCTION
The processing of fruits and vegetables for discarding a huge amount of by-products, which consisted of inedible such parts as peel, seeds, stems and leaves. Almost, these unused tissues are engendering a bad impact on the environment1. These wastes contain many functional and nutraceutical components that can be reused in a lot of industries. They are sources of bioactive compounds such as vitamins, minerals, phenolic compounds, terpenes and fibers, mainly composed of lignocellulose1,2.
The strawberry, familyRosaceaeand genusFragaria are worldwide distributed3. Regarding to its nutrient value, it represents a good healthy food choice. Strawberries have fiber and fructose contents that may be considered a blood sugar level regulator and are a source of healthy essential fatty acids4-6. Strawberry is an excellent source of manganese, potassium and a good source of iodine, magnesium, copper, iron and phosphorus5.
Strawberries are rich in vitamin C, even higher than citrus fruits and also the source of dietary antioxidants such as vitamins (i.e., vitamin A and tocopherol) and carotenoids (i.e., lutein and zeaxanthin)7. Vitamin C and folate play an important role in health promotion and disease prevention, where strawberry is the richest natural source of this essential micronutrient8-10.
Fruit processing generally produces great amounts of residues, which if recycled, may act as an important source that constitutes high values and can be added to many products11.
Strawberry processing is one of the most important around the world locally and worldwide. The post-harvest processing of strawberries produces huge amounts of residues which consist of the inedible parts of the fruit (sepal, calyx and stem) which is an environmental problem for local producers and industries, the amount of these residues representing up to 20% of the total production12. These plant by-products can be submitted as a source of bioactive and functional compounds, due to their content of phenolics. The extracts of different parts of the strawberry plant may show a different phenolic components profile characterized by the presence of ellagitannins, flavonoids and phenolic acids. Ellagic acid was found in every part of the strawberry plant except the root. These findings supported that the non-edible parts of the strawberry plant have a big potential to be used as ingredients for functional food products6,13,14.
Animal feed is the main option to control strawberry residues, which cause greenhouse emissions due to the high organic load. This alternative management is required to avoid severe environmental impacts, such as negative effects on agricultural soil quality, pollution of aquatic ecosystems and atmospheric pollution15,16.
This study aimed to the use of the strawberry by-product (calyces) which may constitute a promising source of antioxidants and micronutrients and could therefore be an alternative and cost-effective way of supplementing the tilapia diet.
MATERIALS AND METHODS
Study area: The experiment was conducted at Fish Nutrition Laboratory, EL-Kanater El-Khayria Station, National Institute of Oceanography and Fisheries (NIOF), Cairo, Egypt, from 18 May, 2021 to 4 August, 2021.
Plant material preparation: The by-products of strawberry (Fragaria) were obtained from the local market. The residues consisted of sepals and peduncles (calyces) which were collected and weighed, squashed then sun-dried and powdered and packed in plastic bags.
Diets formulation: Four experimental diets (40.03% CP, 399.61 kcal) were used as follows: SC1, SC2 and SC3 by adding 1, 2 and 3% Strawberry Calyces (SC), respectively, besides to control (0%), diet formula and chemical composition were shown in Table 1.
Fish and experimental design: This study was conducted with Nile tilapia, Oreochromis niloticus and fry which were reared under optimal conditions for a week before the starting of the growth trials. Fries with an initial body weight of 1.53±0.02 g, were randomly distributed and reared in 12 glass aquaria (70 L) each, stocked with 20 fry per aquarium. The fish were fed three times a day at 9 am, 12 and 3 pm and weighed biweekly. The water was partially changed day after day and the main water parameters (temperature, dissolved oxygen and pH) were measured through the experimental period (70 days).
Growth performance: The random samples of fish were collected biweekly to investigate the growth parameters that were calculated according to the following Eq. by17:
| Table 1: | Formulation and proximate analysis of the test diets | |||
Experimental diets ---------------------------------------------------------------------------------------------------- |
||||
| Ingredients (%) | Control | SC1 | SC2 | SC3 |
| Fishmeal | 20.5 | 20.5 | 20.5 | 20.5 |
| Soybean meal | 50 | 50 | 50 | 50 |
| Corn gluten meal | 7 | 7 | 7 | 7 |
| Wheat bran | 20.5 | 20.5 | 20.5 | 20.5 |
| Sunflower oil | 1 | 1 | 1 | 1 |
| Premix1 | 1 | 1 | 1 | 1 |
| Cr2O3 | 0.5 | 0.5 | 0.5 | 0.5 |
| Additive dried (SC) | 0 | 1 | 2 | 3 |
| Chemical composition (%) | ||||
| Dry matter | 90.38 | 89.67 | 88.97 | 88.26 |
| Crude protein | 40.03 | 39.7 | 39.37 | 39.04 |
| Ether extract | 4.03 | 4.09 | 4.15 | 4.21 |
| Ash | 8.29 | 8.34 | 8.39 | 8.44 |
| Crude fiber | 5.92 | 6.04 | 6.13 | 6.23 |
| NFE2 | 31.13 | 31.5 | 31.63 | 31.75 |
| Gross energy (kcal) | 399.61 | 399.23 | 399.1 | 398.51 |
One kg premix contained:
- Vitamins: -48×105 I.U. (A), 6×10² mg (B6), 20 mg (Biotin), 8×10⁵ I.U. (D3), 144 mg (E), 400 mg (B1), 1600 mg (B2), 4×10³ mg (Pantothenic acid), 4 mg (B12), 4×10² mg (Niacin), 2×10⁵ mg (Choline chloride) and 400 mg (folic acid)
- Minerals: -12×103 mg iron, 16×103 mg manganese, 12×102 mg copper, 120 mg iodine, 80 mg cobalt, 40 mg selenium and 16×103 mg Zinc
Feed utilization parameters:
Where, Gross energy = 5.7×g protein+9.4×g fat+4.1×g carbohydrate18.
Flesh condition indicators: The normality of the fish body growth was measured using the formula19:
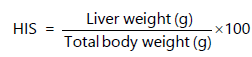
Hepato-Somatic (HSI) and Gastro-Somatic (GSI) were calculated as the following equations by20:
 |
|
Digestibility: Apparent Protein Digestibility (APD) was measured by using 21 methods. Fish final weight was recorded, then the digestion trial was started where the uneaten diet and feces were collected once daily for 15 days by siphoning. Feces were collected separately, 2 hrs after feeding, then filtered and dried at 60°C and stored for determining the chemical composition. Crude protein contents of the diets and feces were determined. Feces were analyzed separately to determine their values of dry matter and CP.
Biochemical studies
Plant materials analysis: Samples of the additive were analyzed for Crude Protein (CP), Ether Extract (EE), Crude Fiber (CF), ash and minerals using the22 reference methods.
Assessment of the main vitamins in byproducts:
- Ascorbic acid determination: The sample (1.0 g) were extracted in 4% oxalic acid and the solution was brought to 100 mL (V1 mL) and centrifuged at 4032×g for 10 min. Then, 5 mL of the supernatant was mixed with 10 mL of 4% oxalic acid, then the solution was titrated against the dye (V2 mL)23:
 |
- Determination of vitamins: The essential vitamins A, E, K and B were measured in the Central Laboratory of Agricultural Ministry, Dokki, Giza
Amino and fatty acids profiles: Fatty acid and amino acid compositions of the residuewere measured in the Central Laboratory of Agricultural Ministry, Dokki, Giza and were assessed by using the methods recommended in the studies of Bireche et al.24.
Liver health signal of fish: At the end of the trial, random samples of fish liver were taken from each aquarium, then liver tissues were homogenized by 5 mL distilled and liver glycogen was measured (g/100 g fresh tissue) using the following formula:
 |
Total liver protein was extracted by homogenization in trichloroacetic acid, then centrifuged (1008×g) and the hepatic protein content was determined by25 using the following formula:
The samples of 0.5 g of liver were preserved in a 2:1 mix of chloroform/methanol for posterior lipid class analysis26, then the liver lipid content which detected by25:
Carcass analysis: At the end of the experiment, fish samples were taken randomly and analyzed for adjusting the moisture oven-dried (at 85°C till constant weight), crude protein using Kjeldahl, total lipids by the method of ether extraction and the total ash (550°C for 6 hrs)22.
Physiological status: Blood samples (0.5-1 mL blood), at the end of the investigation periods, were taken randomly, by puncture of the caudal vein, using the heparinized syringes for some plasma parameters and syringes without anticoagulant for obtained serum, which was separated by centrifuging at 3000 RPM for 10 min27. Plasma was submitted to measure plasma protein (PTP) according to Riche28. The immunoglobulin (IgM and IgD) were assessed according to Brydges29.
Data statistical analysis: The data were subjected to Analysis of Variance (ANOVA) using the General Linear Models (GLM) procedure, the software used was SPSS (Version 16.0). Duncan’s multiple range tests were used to compare between means of the control and treated groups, the model of analysis was as follows:
Where:
μ |
= |
Overall mean |
Ti |
= |
Effect of treatment |
Eij |
= |
Random error |
RESULTS
Bioassay of strawberry residues
Proximate composition of the strawberry calyces: The present results (Table 2) cleared Those Strawberry Calyces (SC) contain considerable amounts of dry matter, protein, lipid and fiber (19.4, 7.1, 10.11 and 17.51 g/100 g), respectively.
Mineral and vitamin in the additive: Table 3 and Fig. 1 show that SC is a rich source of main minerals such as potassium, sodium, calcium, phosphorus and magnesium and contained vital vitamins like vit. C (20.2 mg/100 g) and minor levels from other vitamins (E, B6, A and K).
Fatty acids content of additive: Table 4 and Fig. 2 verified that calyces contain, saturated and monounsaturated fatty acids196.3 and 185.23% besides to considerable level of polyunsaturated group (523.83%) which consists of ω6 (307.03%) and ω3 (82.11%).
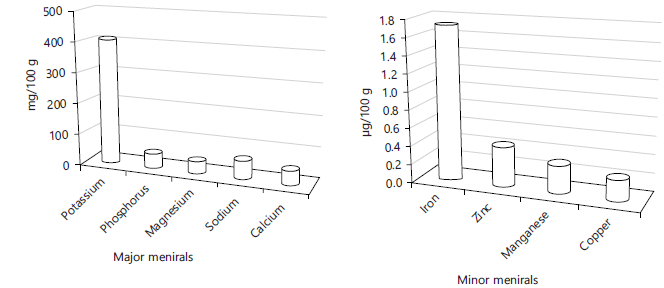 Fig. 1: Illustrate levels of some minerals in calyces |
| Table 2: | Chemical composition of the strawberry by products (Mean value±SE) | |||
| Components (%) | SC |
| Moisture | 80.6±1.92 |
| Dry matter | 19.4±1.05 |
| Protein | 7.1±0.70 |
| Lipid | 10.11±0.90 |
| Ash | 13.95±1.22 |
| Fiber | 17.51±1.03 |
| Carbohydrate | 51.33±2.34 |
| Table 3: | Some vitamins concentration in the strawberry calyces | |||
| Vitamins | Values (mg/100 g) |
| Vit. C | 20.2 |
| Vit. K | 0.007 |
| Vit. B6 | 0.25 |
| Vit. A | 0.035 |
| Vit. E | 0.56 |
| Table 4: | Polyunsaturated fatty acidsprofile in strawberry calyces | |||
| PUFA profile | Percentage |
| 18:00 | 36.1 |
| 18:1n-9 | 84.1 |
| 18:1n-7 | 7.01 |
| 18:2n-6 (ω6) | 307.03 |
| 18:3n-3 (ω3) | 82.06 |
| 20:00 | 4.01 |
| 20:1n-9 | 0.67 |
| 22:00 | 2.85 |
Essential amino acids of the strawberry by-product: The results in Table 5 and Fig. 3 cleared those strawberry calyces have a considerable content of essential amino acids, where glutamic acid was the dominant.
Fish growth performance: Water parameters were in within normal ranges through all the experimental days. Table 6 showed that fish growth parameters as the gain in weight, specific growth rate (Fig. 4) or daily weight gain were enhanced significantly (p<0.05) for all the fish groups fed the three levels of additive and best body condition factor (Fig. 5) and survival rate were improved (p<0.05) for those fed on SC up to 3% level, comparing with control one (0% SC).
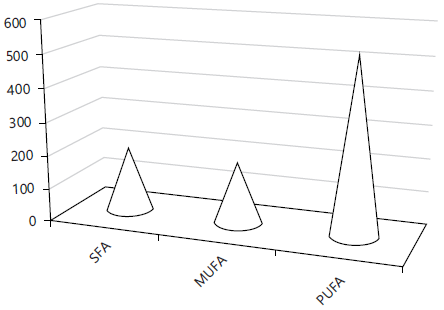 Fig. 2: Total levels of the three main fatty acid groups |
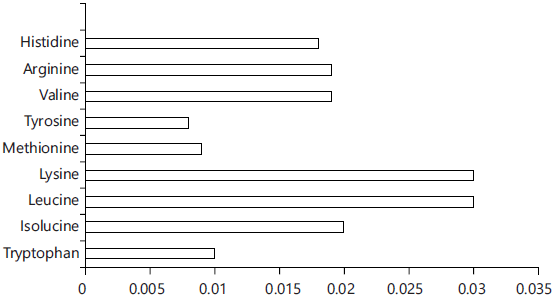 Fig. 3: Essential amino acids in the calyces |
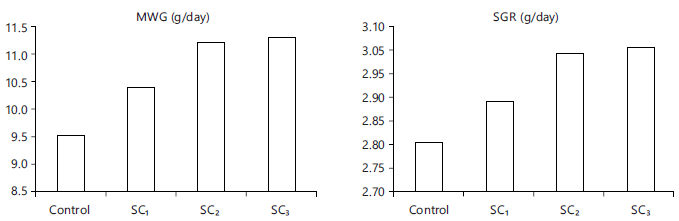 Fig. 4: Growth parameters |
| Table 5: | Percentage of the EAAs in strawberry residues | |||
| Amino acids | Percentage |
| Tryptophan | 0.01 |
| Isolucine | 0.02 |
| Leucine | 0.03 |
| Lysine | 0.03 |
| Methionine | 0.009 |
| Tyrosine | 0.008 |
| Valine | 0.019 |
| Arginine | 0.019 |
| Histidine | 0.018 |
| Glutamic acid | 0.38 |
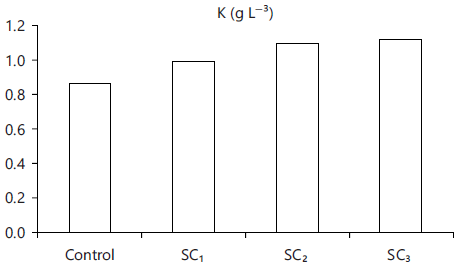 Fig. 5: Condition factor of tilapia fed SC |
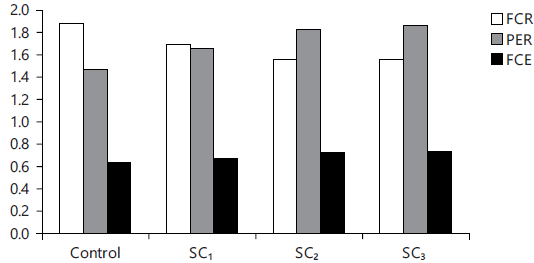 Fig. 6: Feed efficiency ratios |
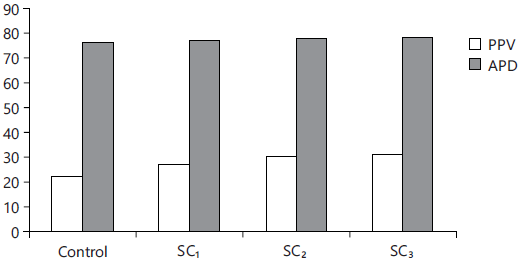 Fig. 7: Protein utilization and digestibility (%) |
| Table 6: | Growth performance of tilapia fed different levels of strawberry calyces | |||
Experimental diets ------------------------------------------------------------------------------------------------------------ |
||||
| Components | Control | SC1 | SC2 | SC3 |
| Initial weight | 1.53±0.03 | 1.54±0.04 | 1.51±0.03 | 1.52±0.02 |
| Final weight | 11.03±0.85c | 11.93±0.69b | 12.71±0.97a | 12.83±0.87a |
| Mean gain in weight | 9.50±0.55c | 10.39±0.64b | 11.20±0.68a | 11.31±0.49a |
| Initial length | 1.50±0.02 | 1.49±0.04 | 1.48±0.03 | 1.51±0.02 |
| Final length | 10.81±0.95a | 10.66±1.03b | 10.50±1.01c | 10.48±0.98c |
| Condition factor (K) | 0.87±0.01c | 0.99±0.01b | 1.10±0.01a | 1.12±0.02a |
| Specific Growth Rate (SGR) | 2.82±0.21c | 2.92±0.14b | 3.04±0.23a | 3.05±0.20a |
| Daily Weight Gain (DWG) | 0.136±0.01c | 0.148±0.02b | 0.160±0.01a | 0.162±0.01a |
| Survival rate (%) | 65 | 75 | 80 | 75 |
| Mean values in the same row with different letters, are significantly different (p<0.05) | ||||
Food utilization parameters: The present data (Table 7 and Fig. 6, 7) cleared that PPV, PER, EER, FCE and FCR were the best values (p<0.05) for those fed the levels 2 and 3% SC, compared with the control one.
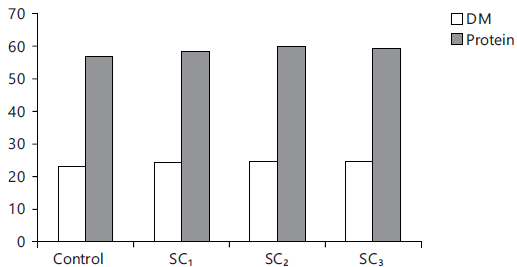 Fig. 8: Carcass protein and dry matter (%) |
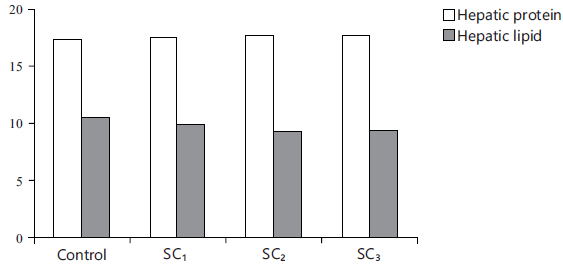 Fig. 9: Comparison of liver composition items |
| Table 7: | Feed utilization | |||
Experimental diets -------------------------------------------------------------------------------------------------- |
||||
| Parameters | Control | SC1 | SC2 | SC3 |
| Feed Intake (FI, g) | 17.87±1.14a | 17.70±1.06b | 17.48±0.97d | 17.62±1.03c |
| Protein Intake (PI, g) | 6.47±0.24a | 6.30±0.32b | 6.12±0.25c | 6.07±0.34d |
| Feed Conversion Ratio (FCR) | 1.88±0.02a | 1.70±0.01b | 1.56±0.02c | 1.55±0.03c |
| Feed Conversion Efficiency (FCE) | 0.63±0.01b | 0.67±0.02b | 0.73±0.01a | 0.73±0.01a |
| Protein Efficiency Ratio (PER) | 1.47±0.23c | 1.65±0.19b | 1.83±0.24a | 1.86±0.35a |
| Energy Intake (EI) | 71.41±3.03a | 70.66±2.53b | 68.71±2.08d | 70.22±2.14c |
| Energy Efficiency Ratio (EER) | 0.13±0.01a | 0.15±0.01a | 0.16±0.02a | 0.16±0.01a |
| Protein Productive Value (PPV, %) | 22.35±1.07d | 26.78±0.98c | 30.21±0.76b | 30.76±1.05a |
| Apparent Protein Digestibility (APD) | 75.92±2.06d | 77.14±2.34c | 77.65±1.98b | 77.95±2.12a |
| Mean values in the same row with different letters are significantly different (p<0.05) | ||||
| Table 8: | Body chemical composition | |||
Experimental diets ------------------------------------------------------------------------------------------------------------------- |
||||
| Parameters | Control | SC1 | SC2 | SC3 |
| DM | 23.15±2.01c | 24.22±1.84b | 24.51±1.52a | 24.53±1.78a |
| Protein | 56.6±1.89c | 58.41±2.03b | 59.37±1.90a | 59.33±2.21a |
| Lipid | 15.72±0.93a | 14.76±0.75c | 14.24±0.98b | 14.25±0.69b |
| Ash | 16.37±1.03b | 16.38±1.21b | 16.65±1.14a | 16.66±1.32a |
| NFE | 11.31±0.56a | 10.45±0.35b | 9.74±0.46c | 9.76±0.24c |
| Moisture | 76.85±2.23a | 75.78±2.16b | 75.49±1.89c | 75.47±2.05c |
| Mean values in the same row with different letters are significantly different (p<0.05) | ||||
Carcass composition of test fish: Data of proximate analysis of fish clarified that the protein content was increased with the increase of the inclusion level of strawberry calyces, accompanied with decreasing of lipid content (Table 8 and Fig. 8). Present results recorded that fish fed (2 and 3%) SC had a higher content of Ash than the control (p<0.05).
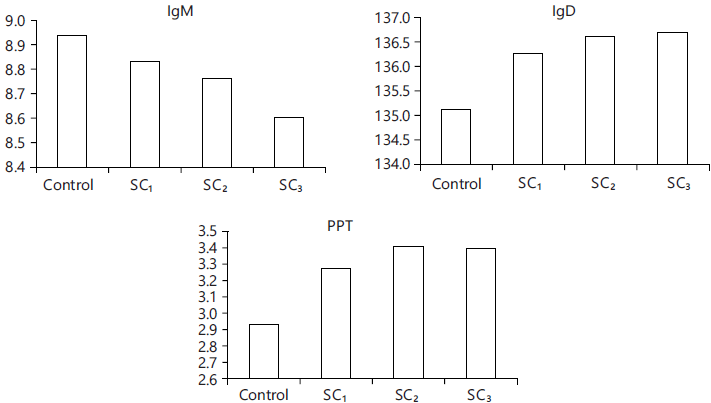 Fig. 10: Blood parameters count |
| Table 9: | Liver analysis components | |||
Experimental diets ----------------------------------------------------------------------------------------------------------------- |
||||
| Liver composition | Control | SC1 | SC2 | SC3 |
| Hepatic protein | 17.43±0.95c | 17.54±0.89b | 17.76±1.02a | 17.81±0.93a |
| Hepatic lipid | 10.64±0.71a | 9.84±0.54b | 9.37±0.67c | 9.40±0.52c |
| Hepatic glycogen | 1.62±0.05b | 1.64±0.04b | 1.75±0.05a | 1.75±0.05a |
| Mean values in the same row with different letters are significantly different (p<0.05) | ||||
| Table 10: | Blood Biochemical parameters of test fish | |||
Experimental diets ----------------------------------------------------------------------------------------------------------------- |
||||
| Liver composition | Control | SC1 | SC2 | SC3 |
| IgM | 8.94±0.91a | 8.83±0.86b | 8.76±0.87c | 8.60±0.95d |
| IgD | 135.12±2.14d | 136.27±1.95c | 136.62±1.64b | 136.70±2.09a |
| PTP | 2.93±0.06c | 3.27±0.04b | 3.41±0.07a | 3.40±0.05a |
| Mean values in the same row with different letters are significantly different (p<0.05) | ||||
Liver composition: Table 9 and Fig. 9 verified that adding the three levels of strawberry calyces for fish diet resulted in high hepatic protein and glycogen, on the other hand, hepatic lipid was decreased with SC inclusion level compared to the control (p<0.05).
Physiological measures in blood: Blood parameters of the fish revealed that Immunoglobulins (IgM and IgD) and Plasma Total Protein (PTP) were enhanced (p<0.05) for the three test fish groups compared to control one (Table 10 and Fig. 10).
DISCUSSION
The present result showed that Strawberry Calyces (SC) contain ambient amounts of macro-nutrients indicating that, SC acts as a good ingredient for fish diets5,6, . At the same trend, results cleared that the SC contains a lot of some micro-nutrients (minerals and vitamins), which play a vital role in fish performance30,31. Stated that the micro-nutrients play an important key in fish growth and immunity.
Strawberry by-products had a similar nutrient composition as strawberry fruit5,6.
Giampieri et al.5 mentioned that strawberry fruit is considered a good source of manganese and potassium and also contains iodine, magnesium, copper, iron and phosphorus. The strawberry contains considerable amounts of vitamin C, even higher than citrus fruits, also some of many other vitamins in minor amounts as a vitamin E, A, B6 and K, thiamine, riboflavin, folate acid and niacin5,8,32.
It should be noted from the present data, the residue (SC) is considered the best source of antioxidant agents, these results are consistent with the interpretation by Nowicka et al.33, who mentioned that antioxidant agents in strawberry wastes can neutralize different free radicals and other reactive oxygen species.
The nutritional composition of fish (as lipids and fatty acids) substantially varies due to the differences in their habitats. In general, freshwater fish require either linolic acid (18:2 n-6), linolenic acid (18:3 n-3) or both, which are stored in muscle tissue to meet physiological needs and are also related to fish growth and survival rates34.
Results with respect to fatty acids recorded that SC contains a high level of ω-6, so the SC acts as a good ingredient for fish feeding, which it agrees with30, when they studied other plant calyces.
The present data showed that SC consists of a balanced profile of amino acids, so, our results are similar to that recorded by Attalla et al.30, who mentioned that some plant calyces (eggplant, pepper and tomatoes) contain an ambient profile of amino acids and glutamic acid was the dominant non-essential amino acid.
A promise growth performance in our results cleared that, the test fish which fed on three levels of SC, especially, in the second and third levels, these results are similar to the results by Attalla et al.30, who fed Nile tilapia a diet containing different plant calyces.
These findings may be due to the plant by-products (SC) containing a nutritional value as mentioned previously (Table 2-5) and also being rich in a bioactive compound5,6. Many studies by other scientific researchers confirmed that bioactive compounds improved fish growth performance, body condition and survival numbers fish30,31.
Optimum results of feed efficiency were accompanied by the lowing of the amount of feed consumed by the test fish for the three examined fish groups, when compared with control, these promising data may lead to saving a considerable part of the cost of feed which represents about 70 % of total fish culture cost.
The digestibility depends mainly on the feed intake and fiber content which increase the movement of the fish intestine causing an increased digestibility. These results may owe to the high fiber content of SC that enhanced the health of the digestive canal30,31.
Although, fiber does not provide the body with nutrients, it is essential in the diet of fish, which lead to promotes some health benefits when using the plant residues and is considered a good food ingredient. Insoluble fiber acts as a regulator and for maintaining digestion efficiency30,31,35-37.
The chemical composition of the examined fish was positively improved by SC inclusion, which may be due to the presence of bioactive components and essential amino acid content of the additive that enhanced the flesh quality of fish5,6,30. Also, the high percentage of minerals in the strawberry calyces may increase the mineral content in the fish flesh30,31.
The fish fed on SC showed enhancement of liver composition, which could be due to the considerable fiber content in SC that may act as liver health protectors, these results agree with those recorded by5,6,30,31.
The blood parameters were improved by the additive inclusion level in the fish diet (p<0.05), these findings are due to the great contents of phenolics, minerals, vitamins (C, K, E, and B) and amino acids in the additive, these results at the same trend with data wrote by5,6,30,38 when they added that, vitamin C has an antioxidant activity that improved immunity with lowing IgM. At the same trend39,40 observed that IgM start to increase when an animal was infected harmfully and then returned to the optimal ranges when infection was reduced, this fact verified our findings, where the additive (SC) may reduce infection or enhance the immune response system of examined fish, with minimizing IgM.
The strawberry contains considerable amounts of vitamin C, even higher than citrus fruits, contributing to 24% of the antioxidant capacity of the strawberry, also it is a good source of many other vitamins such as vitamin E, A, B6 and K, thiamine, riboflavin, folate acid and niacin5,8,32. Also8-10 added that vitamin C and folate are considered important factors in health promotion and disease prevention, where strawberry is the richest natural source of this essential micronutrient.
The presence of the mucous layers on the skin surfaces of the teleost fish causes permanent exposure to a large number of pathogens and high densities of commensal microorganisms in the aquatic environment. The B cells and intra-mucosal immunoglobulins associated with lymphoid tissue play key roles in local mucosal adaptive immune responses. To date, three Ig isotypes (that is, IgM, IgD and IgT/Z) have been identified from the genetic sequences of different species of teleost fish. Crucially, teleost IgT represents the oldest class of AB specialized in mucosal immunity and plays important roles in removing mucosal pathogens and maintaining microbial homeostasis41.
CONCLUSION
The use of the strawberry residue in the tilapia diet can obtain improving fish growth and immunity with optimum quality of flesh and may also reduce environmental pollution.
SIGNIFICANCE STATEMENT
This study discovered the strawberry calyces that can be beneficial for fish nutrition as feed additive that may enhance fish growth performance and immunity. This study will help the researchers to uncover the critical areas of the shortage of fish feed ingredients and may also contribute to reduce environmental pollution and enhance economical profits that many researchers were not able to explore. Thus a new theory on processing of strawberry calyces may be arrived and using as important additive in fish nutrition.
REFERENCES
- Girotto, F., L. Alibardi and R. Cossu, 2015. Food waste generation and industrial uses: A review. Waste Manage., 45: 32-41.
- Ravindran, R., S.S. Hassan, G.A. Williams and A. Jaiswal, 2018. A review on bioconversion of agro-industrial wastes to industrially important enzymes. Bioengineering.
- Antunes, L.E.C. and N.A. Peres, 2013. Strawberry production in Brazil and South America. Int. J. Fruit Sci., 13: 156-161.
- USDA, 2011. US Department of Agriculture, Agriculture Research Service. USDA national nutrient for standard references, release 23. Fruits and fruit juices; 2010, pp: 785-7.
- Giampieri, F., S. Tulipani, J.M. Alvarez-Suarez, J.L. Quiles, B. Mezzetti and M. Battino, 2012. The strawberry: Composition, nutritional quality, and impact on human health. Nutrition, 28: 9-19.
- Zhu, Q., T. Nakagawa, A. Kishikawa, K. Ohnuki and K. Shimizu, 2015. In vitro bioactivities and phytochemical profile of various parts of the strawberry (Fragaria ×ananassa var. Amaou). J. Funct. Foods, 13: 38-49.
- Carr, A.C. and B. Frei, 1999. Toward a new recommended dietary allowance for vitamin C based on antioxidant and health effects in humans. Am. J. Clin. Nutr., 69: 1086-1107.
- Tulipani, S., S. Romandini, J.M.A. Suarez, F. Capocasa and B. Mezzetti et al., 2008. Folate content in different strawberry genotypes and folate status in healthy subjects after strawberry consumption. BioFactors, 34: 47-55.
- Tulipani, S., B. Mezzetti, F. Capocasa, S. Bompadre and J. Beekwilder et al., 2008. Antioxidants, phenolic compounds, and nutritional quality of different strawberry genotypes. J. Agric. Food Chem., 56: 696-704.
- Tulipani, S., B. Mezzetti and M. Battino, 2009. Impact of strawberries on human health: Insight into marginally discussed bioactive compounds for the Mediterranean diet. Public Health Nutr., 12: 1656-1662.
- Balasundram, N., K. Sundram and S. Samman, 2006. Phenolic compounds in plants and agri-industrial by-products: Antioxidant activity, occurrence, and potential uses. Food Chem., 99: 191-203.
- Villamil-Galindo, E., F. van de Velde and A.M. Piagentini, 2021. Strawberry agro-industrial by-products as a source of bioactive compounds: Effect of cultivar on the phenolic profile and the antioxidant capacity. Bioresour. Bioprocess.
- Gündüz, K., 2016. Strawberry: Phytochemical Composition of Strawberry (Fragaria × ananassa). In: Nutritional Composition of Fruit Cultivars, Simmonds, M.S.J. and V.R. Preedy, Academic Press, Cambridge, Massachusetts, ISBN: 978-0-12-408117-8, pp: 733-752.
- van de Velde, F., D. Esposito, M.H. Grace, M.E. Pirovani and M.A. Lila, 2019. Anti-inflammatory and wound healing properties of polyphenolic extracts from strawberry and blackberry fruits. Food Res. Int., 121: 453-462.
- Serrano, A., J.A. Siles, A.F. Chica and M.Á. Martín, 2013. Agri-food waste valorization through anaerobic co-digestion: Fish and strawberry residues. J. Cleaner Prod., 54: 125-132.
- Aharonov-Nadborny, R., M. Raviv and E.R. Graberm, 2016. Soil spreading of liquid olive mill processing wastes impacts leaching of adsorbed terbuthylazine. Chemosphere, 156: 220-227.
- Lugert, V., G. Thaller, J. Tetens, C. Schulz and J. Krieter, 2016. A review on fish growth calculation: Multiple functions in fish production and their specific application. Rev Aquacult., 8: 30-42.
- NRC, 2011. Nutrient Requirements of Fish and Shrimp. National Academy Press, Washington DC, USA, ISBN: 978-0-309-16338-5, Pages: 392.
- Froese, R., 2006. Cube law, condition factor and weight-length relationships: History, meta-analysis and recommendations. J. Appl. Ichthyol., 22: 241-253.
- Schreck, C.B. and P.B. Moyle, 1990. Methods for Fish Biology. 1st Edn., American Fisheries Society, United States, Pages: 704.
- Schaafsma, G., 2005. The protein digestibility-corrected amino acid score (PDCAAS)-A concept for describing protein quality in foods and food ingredients: A critical review. J. AOAC Int., 88: 988-994.
- AOAC International and G.W. Latimer, 2012. Official Methods of Analysis of AOAC International. 19th Edn., AOAC International, Gaithersburg, Maryland, United State, ISBN: 9780935584837, Pages: 127.
- Nwanna, L.C., F. Akomolafe, G. Oboh and L. Lajide, 2011. Effect of the replacement of yellow maize with Saccharomyces cerevisae fermented orange peels on the growth and nutrient utilization of African Catfish, Clarias gariepinus (Burchell, 1822). World Aquaculture, pp.16-21.
- Bireche, M., B. Boulanouar, A. Gherib, A. Gil-Izquierdo, R. Domínguez-Perles and M.A. Ghareeb, 2021. Fatty acid and amino acid composition of Citrullus colocynthis seeds growing in Algeria. Egypt. J. Chem., 8: 4727-4737.
- Bechtel, P.J. and A.C.M. Oliveira, 2006. Chemical characterization of liver lipid and protein from cold-water fish species. J. Food Sci., 71: S480-S485.
- Eliasen, K., E.J. Patursson, B.J. McAdam, E. Pino and B. Morro et al., 2020. Liver colour scoring index, carotenoids and lipid content assessment as a proxy for lumpfish (Cyclopterus lumpus L.) health and welfare condition. Sci Rep.
- Zhu, H., Z. Liu, F. Gao, M. Lu and Yujiao Liu et al., 2018. Characterization and expression of Na+/K+-ATPase in gills and kidneys of the teleost fish Oreochromis mossambicus, Oreochromis urolepis hornorum and their hybrids in response to salinity challenge. Comp. Biochem. Physiol. Part A: Mol. Integr. Physiol., 224: 1-10.
- Riche, M., 2007. Analysis of refractometry for determining total plasma protein in hybrid striped bass (Morone chrysops × M. saxatilis) at various salinities. Aquaculture, 264: 279-284.
- Brydges, N.M., P. Boulcott, T. Ellis and V.A. Braithwaite, 2009. Quantifying stress responses induced by different handling methods in three species of fish. Appl. Anim. Behav. Sci., 116: 295-301.
- Attalla, R.F. and S.H. Fadda, 2022. Comparative studies on combined effects of some plant remnants on the growth performance and immune response of fish. Int. Res. J. Adv. Eng. Sci., 7: 187-195.
- Attalla, R.F., S.S. El-Serafy and S.H. Fadda, 2022. Investigation of pineapple remnants used in fish aqua feeds. Egypt. J. Aquat. Biol. Fish., 26: 1-22.
- Basu, A., A. Nguyen, N.M. Betts and T.J. Lyons, 2014. Strawberry as a functional food: An evidence-based review. Crit. Rev. Food Sci. Nutr., 54: 790-806.
- Nowicka, A., A.Z. Kucharska, A. Sokół-Łętowska and I. Fecka, 2019. Comparison of polyphenol content and antioxidant capacity of strawberry fruit from 90 cultivars of Fragaria × ananassa Duch. Food Chem., 270: 32-46.
- Jardine, T.D., A.W.E. Galloway and M.J. Kainz, 2020. Unlocking the power of fatty acids as dietary tracers and metabolic signals in fishes and aquatic invertebrates. Philos. Trans. R. Soc. B.
- Scorsatto, M., A. de Castro Pimentel, A.J.R. da Silva, K. Sabally, G. Rosa and G.M.M. de Oliveira, 2017. Assessment of bioactive compounds, physicochemical composition, and in vitro antioxidant activity of eggplant flour. Int. J. Cardiovasc. Sci., 30: 235-242.
- Attalla, R.F., S.H. Fadda and F.R. Michael, 2021. Biochemical and nutritional studies on the Nile tilapia fed orange peel additive. Egypt. J. Aquat. Biol. Fish., 25: 307-321.
- Attalla, R.F., S.S. El-Serafy, S.H. Fadda and N.A.H. Abdel-Hameid, 2021. Utilization of taro leaves in diet of the Nile tilapia Oreochromis nloticus. Egypt. J. Aquat. Biol. Fish., 25: 627-643.
- Saptarini, N.M., D. Rahayu and I.E. Herawati, 2019. Antioxidant activity of crude bromelain of pineapple (Ananas comosus (L.) Merr) crown from Subang District, Indonesia. J. Pharm. BioAllied Sci., 11: 551-555.
- Williams, M.A. and D. Hoole, 1992. Antibody response of the fish Rutilus rutilus to the meta cestode of Ligula intestinalis. Dis. Aquat. Org., 12: 83-89.
- Hoole, D., J.W. Lewis, P.M.M. Schuwerack, C. Chakravarthy, A.K. Shrive, T.J. Greenhough and J.R. Cartwright, 2003. Inflammatory interactions in fish exposed to pollutants and parasites: A role for apoptosis and C reactive protein. Parasitology, 126: S71-S85.
- Yu, Y., Q. Wang, Z. Huang, L. Ding and Z. Xu, 2020. Immunoglobulins, mucosal immunity and vaccination in teleost fish. Front. Immunol.
How to Cite this paper?
APA-7 Style
Attalla,
R.F., Fadda,
S.H. (2023). Strawberry Calyx and its Impact on Fish Production Performance. Trends in Agricultural Sciences, 2(1), 13-26. https://doi.org/10.17311/tas.2023.13.26
ACS Style
Attalla,
R.F.; Fadda,
S.H. Strawberry Calyx and its Impact on Fish Production Performance. Trends Agric. Sci 2023, 2, 13-26. https://doi.org/10.17311/tas.2023.13.26
AMA Style
Attalla
RF, Fadda
SH. Strawberry Calyx and its Impact on Fish Production Performance. Trends in Agricultural Sciences. 2023; 2(1): 13-26. https://doi.org/10.17311/tas.2023.13.26
Chicago/Turabian Style
Attalla, Raky, Fakhry, and Susan Hassan Fadda.
2023. "Strawberry Calyx and its Impact on Fish Production Performance" Trends in Agricultural Sciences 2, no. 1: 13-26. https://doi.org/10.17311/tas.2023.13.26

This work is licensed under a Creative Commons Attribution 4.0 International License.