Comparative Analysis of Floristic Diversity in Primary and Secondary Forests at the IFA–Yangambi Experimental Plot, Ituri Forest, D.R. Congo
-
Yakoso Bati
Soil and Environmental Management Laboratory, Faculty Institute of Agronomic Sciences (IFA) of Yangambi, Kisangani, Democratic Republic of Congo
Nsalambi V. Nkongolo

School of Science, Navajo Technical University, Crownpoint, New Mexico 87114, United States
Bilima AngbandimaSoil and Environmental Management Laboratory, Faculty Institute of Agronomic Sciences (IFA) of Yangambi, Kisangani, Democratic Republic of Congo
Etutu RisasiFaculty of Agricultural Sciences, National Pedagogical University, Kinshasa, Democratic Republic of Congo
Seya N’shimbaFaculty of Science, University of Kisangani, Kisangani, Democratic Republic of Congo
| Received 24 Sep, 2025 |
Accepted 10 Dec, 2025 |
Published 31 Dec, 2025 |
Background and Objectives: Deforestation and land-use changes pose a major threat to floristic biodiversity in many forests. This study compared floristic diversity between primary and secondary forests at IFA-Yangambi Experimental Forest Plot, Democratic Republic of Congo. Materials and Methods: Floristic assessments were conducted in eight plots of 100×25 m, four in primary forest and four in secondary forest. Plant species in each plot were inventoried and identified. The Shannon diversity index (H'), Pielou’s evenness, and Sørensen similarity index were used to assess species richness, evenness, and floristic composition. Results: The individual density was higher in the primary forest (588 ind/ha) than in the secondary forest (294 ind/ha), with a statistically significant difference (χ2 = 26.322; p = 0.0018). The primary forest showed greater floristic richness than the secondary forest. Significant differences were observed in species number (t = -8.175; p = 0.0038) and genera (t = -5.435; p = 0.01223), but not in family-level diversity. Functionally, aboveground biomass was concentrated in medium to large diameter classes in the primary forest (up to 43.41 t/ha in the 60-70 cm class; CV = 17.48%), whereas in the secondary forest, biomass was dominated by smaller diameters (68.8 t/ha in the 10-20 cm class; CV = 97.15%), reflecting greater structural heterogeneity. Conclusion: The intensity of anthropogenic disturbances negatively affects species richness, floristic diversity, and functional forest structure
| Copyright © 2025 Bati et al. This is an open-access article distributed under the Creative Commons Attribution License, which permits unrestricted use, distribution, and reproduction in any medium, provided the original work is properly cited. |
INTRODUCTION
The degradation of forest ecosystems is recognized as one of the main drivers of biodiversity loss worldwide. According to FAO1, the global deforestation rate reached more than 13 million hectares per year between 1980 and 1995. Developing countries are experiencing the greatest losses, particularly due to unsustainable agricultural practices and uncontrolled exploitation of natural resources2,3. In the Democratic Republic of Congo (DRC), approximately 60% of the territory is covered by forests, or nearly 130 to 152 million hectares4,5. These forests store up to 140 Gt of CO , representing a major challenge for global climate regulation. However, their coverage is seriously threatened. Recent estimates indicate that the DRC loses approximately 500,000 hectares of its forest cover each year6. A study on the dynamics of deforestation in the Yangambi Biosphere Reserve over the last 30 years. This research highlights an increase in the annual deforestation rate, from 0.18% between 1986 and 2003 to 0.38% between 2003 and 2016, with greater pressure on primary forests than on secondary forests7. This deforestation is mainly caused by slash-and-burn agriculture, artisanal and industrial logging, and the expansion of cash crops such as cocoa and coffee8,9. Many plant species, some of which are rare or endemic, are affected by these changes10,11. Anthropogenic pressure is even greater in densely populated areas, where populations rely heavily on natural resources for their livelihoods12. In Tshopo Province, the concession of the Faculty Institute of Agronomic Sciences (IFA) of Yangambi, located at PK41 along the Ituri road, is facing this dynamic. This region is experiencing significant pressure from human settlement and agricultural activities, compromising the conservation of local biodiversity. Understanding the effects of land use on floristic diversity is essential to guide sustainable management strategies for these ecosystems. This study aims to compare floristic diversity under two land use types in the IFA-Yangambi concession. It seeks to test the hypothesis that the development of agricultural activities leads to a significant regression of the primary forest. Furthermore, it explores whether the proximity of villages exacerbates this regression, with a tendency for vegetation to partially recover as one moves away from inhabited areas.
MATERIALS AND METHODS
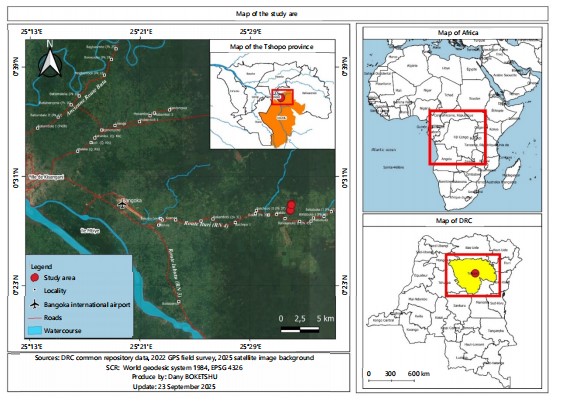
Study site: This study was conducted from May to October, 2022 at IFA-Yangambi Experimental Forest, which covers an area of 67,982 hectares. It is located near the village of Bakilo, at PK 41 on National Road No. 4 (RN4) towards Bunia. Upon arriving in Bakilo, the concession is accessible via an agricultural access road located to the left of the RN4, approximately 800 meters long. Figure 1 shows the location of the IFA-Yangambi concession. This site was chosen due to its proximity to Kisangani, the capital of Tshopo Province, and its easy access via the RN4. The majority of the concession’s land consists of ferralitic soils (Ferralsols or Oxisols), exhibiting varying levels of degradation related to small-scale farming. These soils are divided into four main plant types.
Grassy wasteland (FH): Highly disturbed and highly depleted soils, resulting from more than three crop cycles. Pioneer species such as Diodia sarmentosa, Panicum maximum, Trema orientalis, and Chromolaena odorata are found here.
Forest regrowth (RF): Soils moderately degraded by approximately three agricultural cycles. The vegetation consists of secondary tree species that can reach six meters in height, such as Rauvolfia vomitoria, Macaranga spinosa, Trema orientalis, and Ricinodendron heudelotii.
Secondary forest (FS): Minimally disturbed soils, affected by a single agricultural cycle. The understory is dominated by Marantaceae, while the canopy is characterized by Musanga cecropioides.
Dense forest (DF): Unexploited soils, with climax vegetation dominated by Gilbertiodendron dewevrei and relatively open undergrowth. In its Northwestern part, the concession is crossed by two rivers, Afungwa 1 and Afungwa 2, which offer interesting potential for fishing activities. The terrain is generally flat, punctuated by small mounds. Today, the concession’s forest formations exhibit a high level of fragmentation, mainly due to pressure from agricultural activities. Endangered animal species, such as chimpanzees, are also present. The population of the study area, estimated at 440,259 in 1998, is predominantly rural, with an economy largely based on subsistence farming.
|

|
Sampling approaches
Equipment: The equipment used to conduct the floristic inventory consisted of a Garmin 62 GPS (Global Positioning System), a tape measure, a compass, a machete, and a stake.
Data collection: In the various identified plant formations (ecological environments), 8 plots were demarcated for the floristic inventory: Four in the dense forest and 4 in the secondary forest. The selection of these plots was guided by the diversity of soil types, topography, and accessibility, in order to ensure optimal ecological representativeness of the study site4. Two floristic data collection missions were carried out in January, 2021. In each selected plot, rectangular plots measuring 25×100 m were installed, according to the method described by Abu-Juam and Hawthorne13 and Hawthorne14 (Fig. 2). Within each plot, all visible plant species were identified. For trees and vines with a diameter at breast height (DBH) greater than or equal to 10 cm (measured approximately 1.30 m from the ground), data were systematically recorded. Outside the plots, roving observations were used to add species encountered randomly in the field to the inventory15.
The final floristic list for the IFA-Yangambi concession (PK41) was established by combining surveys in fixed plots and roving observations. This inventory also made it possible to describe the vegetation structure of the different ecological units.
Figure 2 shows the layout of the plots used for surface floristic surveys. (Rectangular plot of 25×100 m, within which all woody species with a diameter at breast height “DBH” ≥10 cm were recorded.
Data analysis: The collected data were used to assess floristic diversity and the structure of woody stands, as well as to estimate biomass and aboveground carbon stocks in the various plant communities of the IFA-Yangambi concession at PK41.
Floral richness: The analysis of floral richness was based on compiling an exhaustive list of woody species recorded in the sample plots. This approach allows for an inventory of the taxa present and an assessment of their distribution according to vegetation types. Species richness is a fundamental indicator for assessing local biodiversity and ecosystem resilience16,17.
Diversity analysis: To better characterize species diversity in the various habitats studied, several ecological indices were calculated.
Sorensen similarity index (Cs): It measures the degree of floristic similarity between two ecological environments (Eq. 1):
| (1) |
where:
| a | = | Number of species in environment A | |
| b | = | Number of species in environment B | |
| c | = | Number of species common to both environments |
This index is suitable for the comparative study of floristic composition18.
Shannon-weaver diversity index (H'): It measures species richness and relative abundance (Eq. 2):
| (2) |
where:
| S | = | Total number of species | |
| P | = | Proportion of individuals of species i |
A high H' indicates a diverse and balanced floristic community19,20.
Pielou’s evenness index (E): It assesses the distribution of individuals among different species (Eq. 3):
| (3) |
where S is the number of species.
A value close to 1 indicates a balanced distribution21,22.
Analysis of stand structure: The study of woody stand structure was conducted at two levels:
Vertical structure: This was described based on the measured heights of the stems recorded in each plot. These heights were compared between vegetation types to identify the dominant strata (herbaceous, shrubby, arboreal) and assess the stratification of plant communities23.
Horizontal structure: The spatial organization of individuals was analyzed using the following parameters:
Woodland density (D): This corresponds to the number of stems per hectare and is calculated by (Eq. 4):
| (4) |
where:
| N | = | Total number of stems recorded | |
| S | = | Total area of the plots (in hectares) |
Basal area (G): This indicator expresses species dominance in terms of woody biomass (Eq. 5):
| (5) |
where:
| d | = | Diameter at breast height (DBH) |
Diameter class distribution: Stems were grouped by diameter class (e.g., 10-20 and 20-30 cm, etc.) to identify demographic structures. An "inverted J" distribution indicates good stand renewal24. For comparability of results, eight plots (four per vegetation type) were selected for the various calculations. All woody species with a DBH greater than 10 cm were considered.
RESULTS
Floristic and structural characteristics
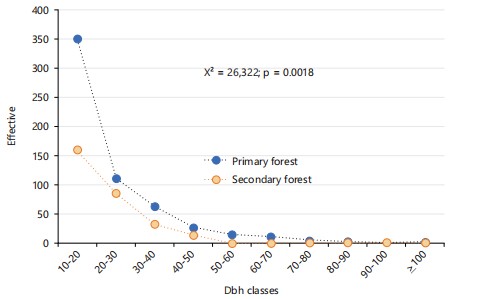
Diameter structures: The results relating to the diameter structures of the two types of forest formations studied are presented in Fig. 3. Analysis of Fig. 3 shows that both forest types, namely primary forest and secondary forest, exhibit an "inverted J" diameter structure. This shape reflects a progressive decrease in the number of individuals as the diameter increases, indicating satisfactory natural regeneration and active forest dynamics in both cases.
In the primary forest, a total of 588 individuals per hectare were recorded. These individuals are divided into ten diameter classes. The 10 to 20 cm class recorded the largest number of individuals, namely 350. It is followed by the 20 to 30 cm class with 111 individuals, the 30 to 40 cm class with 63 individuals, the 40 to 50 cm class with 27 individuals, and then the 50 to 60 cm class with 15 individuals. The following classes recorded lower numbers: 11 individuals for the 60-70 cm class, 5 individuals for the 70-80 cm class, 3 individuals for the 80-90 cm class, 1 individual for the 90-100 cm class, and finally 2 individuals for the class with a diameter greater than or equal to 100 cm. Regarding the secondary forest, the density was 294 individuals per hectare. Here too, ten diameter classes were identified. The 10-20 cm class had the largest number of individuals, at 160. This was followed by the 20-30 cm class with 85 individuals, the 30-40 cm class with 33 individuals, and the 40-50 cm class with 14 individuals. The 70-80 cm and 90-100 cm classes each recorded only one individual, while no individuals were observed in the 50-60 cm, 60-70 cm, and diameter classes greater than or equal to 100 cm. Statistical analysis using the Chi-square test compared the distribution of individuals by diameter class between the two forest types. The results indicate a statistically significant difference between the distributions, with a Chi-square value of 26.322 and a p-value of 0.0018. This indicates that the diameter structure depends on the forest type, reflecting different ecological dynamics related to successional stages, previous disturbances, and local regeneration conditions.
Species richness: The results relating to species richness for the 2 types of forest formations studied (primary forest and secondary forest) located in the concession of the Yangambi Faculty of Agricultural Sciences in Kisangani (PK 40 km) are presented in Table 1.
|
| Table 1: | Species richness of primary and secondary forests in the IFA-Yangambi concession (expressed per 0.25 ha stand) | |||
| Primary forest (Stand/1ha) | Secondary forest (Stand/1ha) | ||||||||
| P1 | P2 | P3 | P4 | P1 | P2 | P3 | P4 | ||
| Species | 41 | 35 | 28 | 35 | 29 | 22 | 21 | 24 | |
| Genera | 33 | 29 | 24 | 31 | 25 | 20 | 20 | 20 | |
| Families | 17 | 19 | 15 | 19 | 17 | 13 | 14 | 16 | |
| P1-P4 represent four independent stands sampled from each forest type | |||||||||
The analysis of Table 1 reveals that in the primary forest, the species richness reaches a total of 69 species per hectare, distributed in 52 genera and 25 botanical families. In the secondary forest, it is slightly lower, with 49 species distributed in 41 genera and 22 families. At the scale of plots of 0.25 hectares, the data show that in the secondary forest, the number of species varies from 21 to 29, with an average of 24.00±2.50 species/0.25 ha. The number of genera varies between 20 and 25, with an average of 21.25±1.86 genera, while the number of botanical families varies from 13 to 17, with an average of 15.00±1.50 botanical families/0.25 ha.
In the primary forest, the observed values indicate a variation in the number of species between 28 and 41 per plot, with an average of 34.75±3.37. The number of genera ranges from 24 to 33, with an average of 29.25±2.75, and the number of botanical families varies from 15 to 19, for an average of 17.50±1.50. Analysis of Variance (ANOVA) performed on the secondary forest data did not show significant differences between plots for the number of species (F = 0.02181, df = 3, p-value = 0.9953), genera (F = 0.01383, df = 3, p-value = 0.9976), or families (F = 0.01485, df = 3, p-value = 0.9973). However, application of the Tukey test for multiple comparisons revealed a significant difference between the second and third plots regarding the number of species (p-value = 0.0415).
In the primary forest, the results of the analysis of variance also indicate the absence of significant differences for species (F = 0.02312, df = 3, p-value = 0.9949), for genera (F = 0.01733, df = 3, p-value = 0.9966) as well as for botanical families (F = 1.22222, df = 3, p-value = 0.9980). Furthermore, the results of the Student t-test applied to compare the two forest types show significant differences in terms of the number of species (t = -8.175, p-value = 0.0038) and genera (t = -5.435, p-value = 0.01223), but no significant difference is observed for the number of botanical families (t = -1.89, p-value = 0.1552).
The calculated coefficients of variation reveal a relatively homogeneous distribution of data concerning the number of species, genera, and families in the two forest types studied, which confirms the local structural stability of the floristic populations in these plant formations.
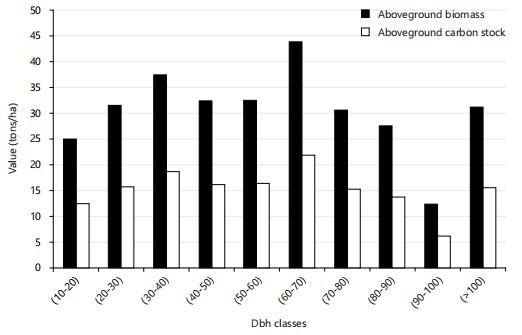
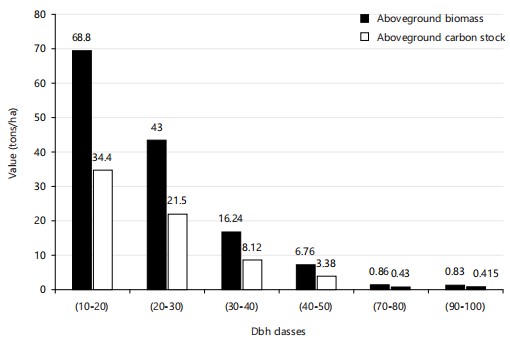
Aboveground biomass and carbon stock by DBH class: Figure 4 and 5 present the results for aboveground biomass and carbon stock by diameter at breast height (DBH) class in the two forest types studied (primary and secondary).
Analysis of Fig. 4 indicates that in primary forests, the 60-70 cm DBH class recorded the highest biomass, at 43.41 t/ha, corresponding to a carbon stock of 21.7 t/ha. It is followed by the class 30-40 cm (37.08 t/ha of biomass; 18.54 t/ha of carbon), 50-60 cm (32.20 t/ha; 16.10 t/ha), 40-50 cm (32.04 t/ha; 16.02 t/ha), 20-30 cm (31.17 t/ha; 15.58 t/ha), >100 cm (30.76 t/ha; 15.38 t/ha), 70-80 cm (30.18 t/ha; 15.09 t/ha), 80-90 cm (27.25 t/ha; 13.62 t/ha), 10-20 cm (24.75 t/ha; 12.37 t/ha), and finally 90-100cm (11.93 t/ha; 5.96 t/ha).
Figure 5 reveals that in secondary forests, the 10-20 cm DBH class contains the largest amount of biomass, with 68.8 t/ha, or 34.4 t/ha of carbon. This is followed by the 20-30 cm classes (43 t/ha; 21.5 t/ha), 30-40 cm (16.24 t/ha; 8.12 t/ha), 40-50 cm (6.76 t/ha; 3.38 t/ha), and finally the 70-80 and 90-100 cm classes, whose biomass is less than 1.00 t/ha.
|
|
The calculated Coefficients of Variation (CV) indicate a homogeneous distribution of biomass and carbon stock data in primary forests (CV = 17.48%, or <30%). On the other hand, a great heterogeneity is observed in the secondary forest (CV = 97.15%, i.e.,>30%).
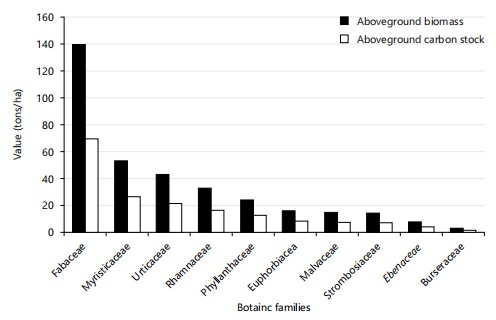
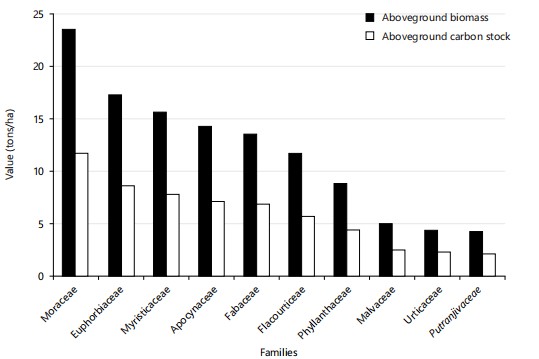
Aboveground biomass and carbon stock by botanical family: Figure 6 and 7 present the results for aboveground biomass and carbon stock by the ten main botanical families identified in the two forest types studied (primary and secondary).
Analysis of Fig. 6 shows that in the primary forest, the Fabaceae family stores the greatest amount of carbon, with 138.32 t/ha of biomass, or 69.16 t/ha of carbon. It is followed by the families Myristicaceae (52.11 t/ha of biomass; 26.05 t/ha of carbon), Urticaceae (42.19 t/ha; 21.09 t/ha), Rhamnaceae (31.28 t/ha; 15.64 t/ha), Phyl-lanthaceae (22.88 t/ha; 11.44 t/ha), Euphorbiaceae.
|
|
(14.62 t/ha; 7.31 t/ha), Malvaceae (13.76 t/ha; 6.88 t/ha), Strombosiaceae (12.78 t/ha; 6.39 t/ha), Ebenaceae (6.42 t/ha; 3.21 t/ha) and finally Burseraceae (1.19 t/ha; 0.59 t/ha). In the secondary forest (Fig. 7), the Moraceae family has the largest amount of biomass, with 23.38 t/ha, or 11.69 t/ha of carbon. This is followed by Euphorbiaceae (17.15 t/ha; 8.57 t/ha), Apocynaceae (14.20 t/ha; 7.10 t/ha), Fabaceae (13.45 t/ha; 6.72 t/ha), Flacourtiaceae (11.53 t/ha; 5.76 t/ha), Phyllanthaceae (8.64 t/ha; 4.32 t/ha), Malvaceae (4.87 t/ha; 2.43 t/ha), Urticaceae (4.27 t/ha; 2.13 t/ha), and finally Putranjivaceae (4.07 t/ha; 2.03 t/ha). Furthermore, the calculated Coefficients of Variation (CV) reveal a strong heterogeneity in the distribution of biomass and carbon stock data, both in the primary forest (CV = 93.63%) and in the secondary forest (CV = 42.95%), these values being both above the 30% threshold.
|
|
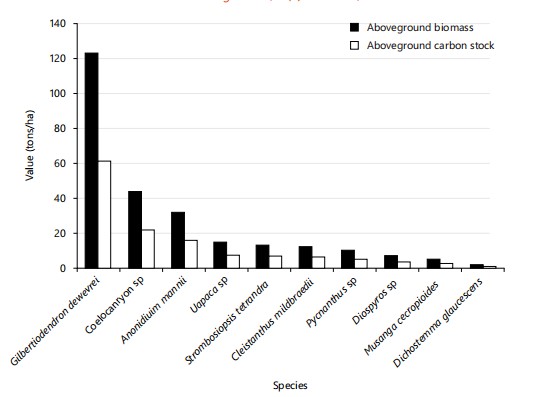
Aboveground biomass and carbon stock by species: Figure 8 and 9 present the distribution of aboveground biomass and carbon stock by the ten main species identified in the two types of forests studied (primary forest and secondary forest). Analysis of Fig. 8 reveals that in the primary forest, the species Gilbertiodendron dewevrei dominates b y a large margin, with a biomass of 122.33 tonnes/ha, corresponding to a carbon stock of 61.15 tonnes/ha. It is followed by Coelo-caryon sp. (43.18 t/ha of biomass; 21.59 t/ha of carbon), Anonidium mannii (31.26 t/ha; 15.63 t/ha), Uapaca sp. (14.56 t/ha; 7.28 t/ha), Strombosiopsis tetrandra (12.65 t/ha; 6.32 t/ha), Cleistanthus mildbraedii (11.35 t/ha; 5.67 t/ha), Pycnanthus sp. (8.92 t/ha; 4.46 t/ha), Diospyros sp. (6.82 t/ha; 3.41 t/ha), Musanga cecropioides (4.21 t/ha; 2.10 t/ha) and finally Dichostemma glaucescens (1.27 t/ha; 0.63 t/ha).
|
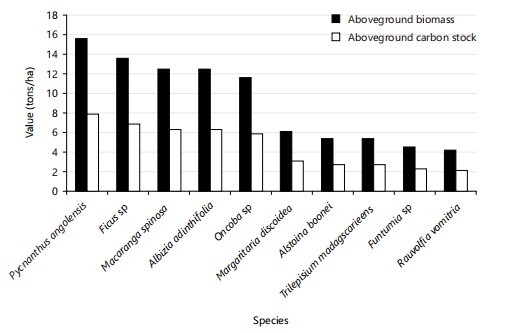
In the secondary forest (Fig. 9), the species Pycnanthus angolensis ranks first with 15.1 tonnes/ha of biomass and 7.55 tonnes/ha of carbon. It is followed by Ficus sp. (13.49 t/ha; 6.74 t/ha), Macaranga spinosa (12.36 t/ha; 6.18 t/ha), Albizia sp. (12.33 t/ha; 6.17 t/ha), Oncoba sp. (11.53 t/ha; 5.76 t/ha), Margaritaria discoidea (6.00 t/ha; 3.00 t/ha), Alstonia boonei (5.33 t/ha; 2.66 t/ha), and Trilepisium madagascariense (5.24 t/ha; 2.62 t/ha). Furthermore, the coefficients of variation obtained indicate a strong heterogeneity in the distribution of biomass and aboveground carbon, with a CV of 58.32% for primary forest and 44.19% for secondary forest. These values, well above the 30% threshold, confirm a significant variability between the dominant species in each forest type.
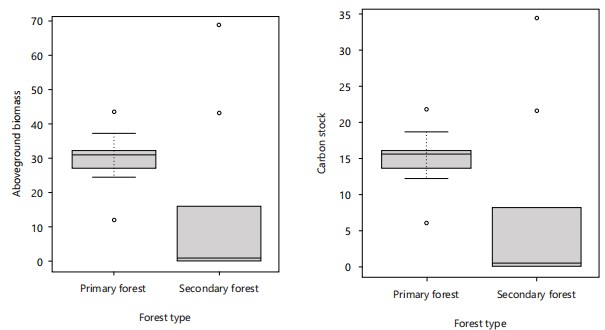
Dispersion of aboveground biomass and carbon stock values in two forests: The results for the dispersion of aboveground biomass and carbon stock values in the two forest types studied are illustrated in Fig. 10.
Observing the boxplots of aboveground biomass (left) and carbon stock (right), based on diameter at breast height (DBH) classes in the two forest types, clearly shows that the distribution of the data differs between them. This difference is particularly highlighted by the position of the medians, which are clearly distinct between the two forests. In the primary forest, carbon stock ranges from 5.69 to 21.70 tons/ha, with a median of 11.93 tons/ha. Aboveground biomass ranges from 11.93 to 43.41 tons/ha, with a median of 31.17 tons/ha.
In contrast, in secondary forests, carbon stock ranges from 0.41 to 34.40 tons/ha, with a median of 8.12 tonnes/ha, while aboveground biomass ranges from 0.83 to 68.80 tonnes/ha, with a median of 16.24 tonnes/ha.
It is also important to note the presence of extreme values (or outliers) in both forest types, for both biomass and carbon stock.
Application of the student t-test reveals highly significant differences between the two forest types, both in terms of biomass and carbon stock (t = 5.2874; df = 18; p-value = 0.00005006 ***), thus confirming statistically proven heterogeneity between these two forest ecosystems.
DISCUSSION
The results obtained on the diameter structures of the primary and secondary forests of the IFA-Yangambi concession reveal distinct ecological dynamics, reflecting the stages of forest succession and past disturbances.
The "inverted J" structure observed in both forest types indicates active natural regeneration, characterized by an abundance of individuals in the small diameter classes and a progressive decrease toward the larger diameter classes. This distribution is typical of tropical forests in equilibrium, where natural mortality and regeneration compensate each other25.
In the primary forest, the high density of individuals (588 individuals/ha) and the presence of large-diameter trees suggest a mature forest with continuous regeneration dynamics. The dominance of Gilbertiodendron dewevrei, a species characteristic of the dense humid forests of Central Africa, contributes to this stable structure26.
In contrast, the secondary forest exhibited a lower density (294 individuals/ha) and an absence of individuals in the larger diameter classes, reflecting an earlier successional phase following a disturbance. This type of structure is common in secondary forests, where fast-growing pioneer species dominate the early stages of regeneration27. Statistical analysis (Chi-square test) confirmed a significant difference between the diameter distributions of the two forests, highlighting the impact of past disturbances and successional stages on forest structure.
These observations are consistent with forest succession models described in the literature, where secondary forests gradually evolve towards more complex and diverse structures, similar to those of primary forests, as succession progresses28.
The species richness observed in the primary and secondary forests of the IFA-Yangambi concession reflects distinct ecological dynamics, influenced by the degree of disturbance and the stage of forest succession. The results show that the primary forest harbors higher floristic diversity than the secondary forest, which is consistent with observations made in other studies in Central Africa. In the primary forest of the IFA-Yangambi concession, an average of 34.75±3.37 species per 0.25 ha plot was recorded, compared to 24.00±2.50 species in the secondary forest. This significant difference (t = -8.175, p = 0.0038) highlights the impact of anthropogenic disturbances on floristic composition. Similar studies conducted in the Masako Forest Reserve, also located near Kisangani, revealed that primary forest has lower rodent species richness compared to disturbed habitats, such as secondary forest and fallow, but higher evenness, indicating a more even distribution of species29.
Furthermore, a comparative study in the Likouala region of the Republic of Congo showed that mature primary forests possess higher species richness than secondary forests, with a dominance of slow-growing species and a more complex forest structure30. These observations corroborate the results obtained in Yangambi, suggesting that primary forests retain higher floristic diversity due to their advanced conservation status and the presence of climax species.
In contrast, secondary forests, although exhibiting lower species richness, play a crucial role in forest regeneration. According to the proceedings of the FAO/IUCN Regional Workshop on the Management of Secondary Tropical Forests in French-speaking Africa, secondary forests harbor significant floristic diversity, with more than 2,000 species and infraspecific taxa representing approximately 800 genera and 150 families, all vascular species31.
These forests serve as reservoirs of biodiversity and contribute to the resilience of forest ecosystems in the face of disturbances.
The higher species richness observed in the Yangambi primary forest is consistent with regional trends, highlighting the importance of conserving primary forests to maintain biodiversity. However, secondary forests, despite lower species richness, play a critical role in forest dynamics and long-term biodiversity conservation.
The results show marked differences between the primary and secondary forests of the IFA-Yangambi concession with regard to the distribution of aboveground biomass and carbon stock by diameter at breast height (DBH) class.
In the primary forest, biomass is mainly concentrated in the intermediate to high DBH classes, particularly the 60-70 cm class (43.41 t/ha of biomass; 21.7 t/ha of carbon), followed by the 30-40, 50-60, and 40-50 cm classes. This structure is characteristic of old-growth or minimally disturbed forests, where large-diameter trees, although few in number, store a significant proportion of the total biomass. These observations are consistent with those of Putz et al.31 who showed that in the dense humid forests of Northern Congo, large diameter trees (≥70 cm) represent up to 35.91% of the total biomass despite their low relative density.
The relatively homogeneous distribution of biomass by DBH class in primary forest (CV = 17.48%) reflects a stable forest structure, typical of mature forest ecosystems. In fact, old-growth tropical forests often exhibit a regular biomass distribution, with accumulation in higher DBH classes due to the long growth duration of climax species.
Conversely, in secondary forest, biomass is highly concentrated in lower DBH classes, particularly 10-20 cm (68.8 t/ha biomass; 34.4 t/ha carbon) and 20-30 cm. This distribution suggests a predominance of fast-growing pioneer species and a near-total absence of large-diameter trees, which is typical of forests regenerating after disturbance27.
The high coefficient of variation (CV = 97.15%) reflects a high heterogeneity in biomass, reflecting the spatial variability common in young secondary forests, as also noted by Fayolle et al.32 in their studies on transitional forests in Central Africa.
Furthermore, Ekoungoulou et al.33 showed that secondary forests in the Congo Basin have carbon stocks dominated by trees with a DBH of less than 30 cm, with forest dynamics strongly influenced by growth rate and initial species composition. The significant difference observed between the two forest types confirms that aboveground biomass and carbon are not only a function of the number of trees, but also, more importantly, of their size and successional stage. These results are therefore consistent with those of Slik et al.23 who showed that biomass is strongly correlated with tree size in tropical rainforests.
The analysis of the results shows a clear differentiation between primary and secondary forests regarding the contribution of botanical families to aboveground biomass and carbon stock.
In primary forests, the Fabaceae family largely dominates, with 138.32 t/ha of biomass (69.16 t/ha of carbon). This predominance can be explained by the high representation of large leguminous trees in old-growth tropical forests, which generally have a high wood density and large size, giving them a high carbon storage capacity. These results are consistent with those of Fayolle et al.32 who observed that Fabaceae are among the most important families in terms of biomass in the dense forests of Central Africa.
The following families (Myristicaceae, Urticaceae, Rhamnaceae, and Phyllanthaceae) also show significant contributions to biomass, although significantly lower than those of Fabaceae. This pattern indicates a floristic structure dominated by species typical of mature forests, often slow-growing but with high biomass value. This is consistent with the observations of Lewis et al.34, who emphasize that functional diversity and floristic composition strongly influence carbon distribution in old-growth tropical forests. The high coefficient of variation (CV = 93.63%) in the primary forest, however, shows a very uneven distribution of biomass among families, reflecting a strong ecological specialization of some families to store carbon, notably due to their dominance in terms of size or abundance.
In secondary forests, the situation is different. The dominant family is Moraceae (23.38 t/ha of biomass; 11.69 t/ha of carbon), followed by Euphorbiaceae, Apocynaceae, and Fabaceae. The dominance of Moraceae is likely explained by the presence of pioneer species such as Ficus spp., often very abundant in regenerating forests, as reported by Slik et al.23. These species have rapid growth but often have lower wood density, which limits their long-term carbon storage capacity compared to climax species.
The presence of pioneer families (Euphorbiaceae, Apocynaceae, Flacourtiaceae) in second place is characteristic of young secondary forests, where fast-growing species dominate. The lower coefficient of variation (CV = 42.95%) reflects a relatively less unequal distribution than that observed in the primary forest, which may be linked to the absence of exceptionally dominant species in terms of biomass in these early stages of succession.
These results therefore highlight that carbon stock is not only a function of tree diameter and height, but also of their taxonomic affiliation, which determines their wood density, growth rate, and longevity, as demonstrated by Cassart et al.35 as well as other authors.
The results obtained reveal a clear difference in the contribution of species to aboveground biomass and carbon stock between the primary and secondary forests of the IFA-Yangambi concession. In the primary forest, Gilbertiodendron dewevrei largely dominates with a biomass of 122.33 t/ha and a carbon stock of 61.15 t/ha. This dominance is consistent with the observations of Cassart et al.35, who highlighted the prominent role of Gilbertiodendron. dewevrei in the monodominant forests of the Congo Basin, contributing significantly to carbon storage due to its large size and longevity. Furthermore, Lokonda et al.36 noted that G. dewevrei strongly influences the structure and dynamics of the forests where it occurs, thus enhancing its capacity to store carbon.
Other notable species in the primary forest, such as Coelocaryon sp. (43.18 t/ha biomass; 21.59 t/ha carbon) and Anonidium mannii (31.26 t/ha; 15.63 t/ha), also contribute significantly to the carbon stock. This diversity of high-biomass species highlights the complexity and maturity of the primary forest, where slow-growing, large-bodied species predominate.
In contrast, the secondary forest exhibits a different structure, dominated by fast-growing pioneer species. Pycnanthus angolensis is the most dominant species with a biomass of 15.1 t/ha and a carbon stock of 7.55 t/ha.
This dominance is typical of regenerating secondary forests, where species such as Ficus sp., Macaranga spinosa, and Albizia sp. play a crucial role in the early stages of ecological succession. For example, Albizia gummifera has been identified as a dominant species in several studies on secondary forests, contributing significantly to carbon storage due to its rapid growth and ability to quickly colonize disturbed areas.
The coefficients of variation (CV) obtained indicate high heterogeneity in the distribution of biomass and aboveground carbon, with a CV of 58.32% for primary forest and 44.19% for secondary forest. These values, above the 30% threshold, reflect the variability in the contributions of different species to carbon storage, influenced by factors such as tree size, stand density, and the ecological characteristics of each species.
The dispersion of aboveground biomass and carbon stock values between the primary and secondary forests studied reveals significant differences, both in terms of distribution and variability. These observations are consistent with the results of other research conducted in similar tropical ecosystems. In the primary forest, aboveground biomass ranged from 11.93 to 43.41 t/ha, with a median of 31.17 t/ha, while carbon stock ranged from 5.69 to 21.70 t/ha, with a median of 11.93 t/ha. These values indicate a relatively homogeneous distribution, characteristic of mature forests where large trees with high wood densities predominate. In contrast, secondary forest shows greater variability, with aboveground biomass ranging from 0.83 to 68.80 t/ha (median 16.24 t/ha) and carbon stock from 0.41 to 34.40 t/ha (median 8.12 t/ha).
This heterogeneity can be attributed to the presence of fast-growing, low-density pioneer species, as well as a less stable forest structure. Research in Indonesia showed that the aboveground biomass of secondary forests (140.7 Mg/ha) was approximately 2.5 times lower than that of primary forests (349.9 Mg/ha), highlighting the impact of disturbance and regeneration on carbon storage37.
Statistical analysis using the Student t-test confirmed these differences, with a t-value of 5.2874, degrees of freedom (df) of 18, and a p-value of 0.00005006, indicating a highly significant difference between the two forest types. These results are consistent with the observations of Poorter et al.38,39, who reported that secondary forests exhibit higher variability in terms of biomass and carbon stock, due to their successional stage and species composition.
CONCLUSION
This comparative study revealed clear differences in floristic composition, structural organization, and ecological attributes between the primary and secondary forests of the IFA-Yangambi concession (PK41, Ituri road). Both forests exhibited an inverted J-shaped diameter distribution, indicating active natural regeneration. However, the primary forest showed higher species richness, greater taxonomic diversity, and higher individual density, suggesting greater ecological maturity and stability. In contrast, the secondary forest reflected a more disturbed and heterogeneous structure dominated by smaller diameter classes, indicative of ongoing regeneration following disturbance. Overall, the findings confirm that primary forests play a crucial role in maintaining biodiversity, structural complexity, and carbon balance within tropical ecosystems.
SIGNIFICANCE STATEMENT
This study emphasizes the ecological significance of primary forests in conserving floristic diversity and sustaining ecosystem services. It underlines the necessity of implementing sustainable management and restoration strategies for secondary forests to enhance their ecological resilience. Furthermore, the results highlight that carbon storage capacity is influenced not only by tree size but also by species-specific functional traits such as wood density and growth rate, which determine long-term carbon dynamics.
ACKNOWLEDGMENTS
The authors wish to thank Mr Faidence Mashauri (PhD student) for assisting in data processing. The contribution of Mr. Ugecan Delors Pascal and Morino Mokonzi during field work (soil sampling, forest inventory) is also recognized.
REFERENCES
- FAO, 1997. State of the World's Forests 1997. FAO, Rome, Italy, ISBN: 92-5-103977-1 Pages: 200.
- Musubaho, L., L. Iyongo, J.C. Mukinzi, A. Mukiranya, J. Mutahinga, M. Dufrêne and J. Bogaert, 2024. Anthropogenic effects on amphibian diversity and habitat similarity in the Yoko Forest Reserve, Democratic Republic of the Congo. Diversity, 16.
- Depecker, J., J.A. Asimonyio, R. Miteho, Y. Hatangi and J.L. Kambale et al., 2022. The association between rainforest disturbance and recovery, tree community composition, and community traits in the Yangambi Area in the Democratic Republic of the Congo. J. Trop. Ecol., 38: 426-436.
- Hansen, M.C., P.V. Potapov, R. Moore, M. Hancher, S.A. Turubanova et al., 2013. High-resolution global maps of 21st-century forest cover change. Science, 342: 850-853.
- Kazadi, G.M., M.M. Mukenza, J.K. Tchowa, F. Malaisse and C.K. Kabeya et al., 2025. Assessment of spatial dynamics of forest cover in Lomami National Park (DR Congo), 2008-2024: Implications for conservation and sustainable ecosystem management. Ecologies, 6.
- Potapov, P.V., S.A. Turubanova, M.C. Hansen, B. Adusei and M. Broich et al., 2012. Quantifying forest cover loss in Democratic Republic of the Congo, 2000-2010, with landsat ETM+ data. Remote Sens. Environ., 122: 106-116.
- Koy, J.K., D.A. Wardell, J.F. Mikwa, J.M. Kabuanga, A.M.M. Ngonga, J. Oszwald and C. Doumenge, 2019. Dynamics of deforestation in the Yangambi biosphere reserve (Democratic Republic of Congo): Spatial and temporal variability in the last 30 years [In French]. Bois Forêts Tropiques, 341: 15-28.
- de Wasseige, C., J. Flynn, D. Louppe, F. Hiol Hiol and P. Mayaux, 2014. The Forests of the Congo Basin: State of the Forest 2013. Weyrich, Belgium, ISBN: 9782874892998, Pages: 325.
- Ladewig, M., A. Angelsen, R.N. Masolele and C. Chervier, 2024. Deforestation triggered by artisanal mining in Eastern Democratic Republic of the Congo. Nat. Sustainability, 7: 1452-1460.
- Pennec, F., S. Krief, A. Hladik, C.L. Ayingweu, S. Bortolamiol, J.C.B. Ngawolo and V. Narat, 2016. Floristic and structural vegetation typology of bonobo habitats in a forest-savanna mosaic (Bolobo Territory, D.R.Congo). Plant Ecol. E, 149: 199-215.
- Pathy, K.K., N.B. Flavien, B.K. Honoré, W. Vanhove and P. van Damme, 2021. Ethnobotanical characterization of medicinal plants used in Kisantu and Mbanza-Ngungu territories, Kongo-Central Province in DR Congo. J. Ethnobiol. Ethnomed., 17.
- Geist, H. and E. Lambin, 2003. Is poverty the cause of tropical deforestation? Int. For. Rev., 5: 64-67.
- Abu-Juam, M. and W.D. Hawthorne, 1995. Forest Protection in Ghana: With Particular Reference to Vegetation and Plant Species. World Conservation Union, UK, ISBN-13: 978-2831702612, Pages: 202.
- Hawthorne, W.D., 1996. Holes and the sums of parts in Ghanaian forest: Regeneration, scale and sustainable use. Proc. R. Soc. Edinburgh, Sect. B: Biol. Sci., 104: 75-176.
- Lovett, J.C., S. Rudd, J. Taplin and C. Frimodt-Møller, 2000. Patterns of plant diversity in Africa South of the Sahara and their implications for conservation management. Biodivers. Conserv., 9: 37-46.
- Chao, A., N.J. Gotelli, T.C. Hsieh, E.L. Sander, K.H. Ma, R.K. Colwell and A.M. Ellison, 2014. Rarefaction and extrapolation with hill numbers: A framework for sampling and estimation in species diversity studies. Ecol. Monogr., 84: 45-67.
- Gentry, A.H., 1993. A Field Guide to the Families and Genera of Woody Plants of Northwest South America (Colombia, Ecuador, Peru). Conservation International, Washington, ISBN: 9781881173007, Pages: 895.
- Sørensen, T., 1948. A Method of Establishing Groups of Equal Amplitude in Plant Sociology Based on Similarity of Species Content: And its Application to Analyses of the Vegetation on Danish Commons. Munksgaard, Danmark, Pages: 34.
- Magurran, A.E., 2004. Measuring Biological Diversity. Wiley, United States, ISBN: 9780632056330, Pages: 256.
- Chao, A., C.H. Chiu and L. Jost, 2010. Phylogenetic diversity measures based on Hill numbers. Philos. Trans. R. Soc. B: Biol. Sci., 365: 3599-3609.
- Pielou, E.C., 1966. The measurement of diversity in different types of biological collections. J. Theor. Biol., 13: 131-144.
- Legendre, P. and L. Legendre, 2012. Numerical Ecology. 3rd Edn., Elsevier Science, Amsterdam, Netherlands, ISBN: 9780444538680, Pages: 990.
- Slik, J.W.F., G. Paoli, K. McGuire, I. Amaral and J. Barroso et al., 2013. Large trees drive forest aboveground biomass variation in moist lowland forests across the tropics. Global Ecol. Biogeogr., 22: 1261-1271.
- Phillips, O.L., T.R. Baker, L. Arroyo, N. Higuchi and T.J. Killeen et al., 2004. Pattern and process in Amazon tree turnover, 1976-2001. Philos. Trans. R. Soc. B: Biol. Sci., 359: 381-407.
- Simini, F., T. Anfodillo, M. Carrer, J.R. Banavar and A. Maritan, 2010. Self-similarity and scaling in forest communities. Proc. Natl. Acad. Sci. U.S.A., 107: 7658-7662.
- Hall, J.S., D.J. Harris, K. Saltonstall, V. de Paul Medjibe, M.S. Ashton and B.L. Turner, 2020. Resource acquisition strategies facilitate Gilbertiodendron dewevrei monodominance in African lowland forests. J. Ecol., 108: 433-448.
- Chokkalingam, U. and W. de Jong, 2001. Secondary forest: A working definition and typology. Inter. For. Rev., 3: 19-26.
- Bell, F.W., J. Parton, N. Stocker, D. Joyce and D. Reid et al., 2008. Developing a silvicultural framework and definitions for use in forest management planning and practice. For. Chron., 84: 678-693.
- Mongo, L.I.W., M. Visser, C. de Cannière, E. Verheyen, B.D. Akaibe, J.U. Ali-Patho and J. Bogaert, 2012. Anthropization and edge effects: Impacts on rodent diversity in the Masako Forest Reserve (Kisangani, DR Congo) [In French]. Trop. Conserv. Sci., 5: 270-283.
- Ifo, S.A., J.M. Moutsambote, F. Koubouana, J. Yoka and S.F. Ndzai et al., 2016. Tree species diversity, richness, and similarity in intact and degraded forest in the tropical rainforest of the Congo Basin: Case of the forest of Likouala in the Republic of Congo. Int. J. For. Res., 2016.
- Putz, F.E., G.M. Blate, K.H. Redford, R. Fimbel and J. Robinson, 2001. Tropical forest management and conservation of biodiversity: An overview. Conserv. Biol., 15: 7-20.
- Fayolle, A., J.L. Doucet, J.F. Gillet, N. Bourland and P. Lejeune, 2013. Tree allometry in Central Africa: Testing the validity of pantropical multi-species allometric equations for estimating biomass and carbon stocks. For. Ecol. Manage., 305: 29-37.
- Ekoungoulou, R., X. Liu, J.J. Loumeto, S.A. Ifo, Y.E. Bocko, E.K. Fleury and S. Niu, 2014. Tree allometry in tropical forest of Congo for carbon stocks estimation in above-ground biomass. Open J. For., 4: 481-491.
- Lewis, S.L., B. Sonké, T. Sunderland, S.K. Begne and G. Lopez-Gonzalez et al., 2013. Above-ground biomass and structure of 260 African tropical forests. Philos. Trans. R. Soc. B: Biol. Sci., 368.
- Cassart, B., A.A. Basia, H. Titeux, E. Andivia and Q. Ponette, 2017. Contrasting patterns of carbon sequestration between Gilbertiodendron dewevrei monodominant forests and Scorodophloeus zenkeri mixed forests in the Central Congo basin. Plant Soil, 414: 309-326.
- Lokonda, M., V. Freycon, S. Gourlet-Fleury and F. Kombele, 2018. Are soils under monodominant Gilbertiodendron dewevrei and under adjacent mixed forests similar? A case study in the Democratic Republic of Congo. J. Trop. Ecol., 34: 176-185.
- Mokea, D.A., A.A. Basia and N.V. Nkongolo, 2023. Predicting the distribution of tree species and their biomass in Yangambi Biosphere using spatial interpolation. Trends Agric. Sci., 2: 221-231.
- Poorter, L., F. Bongers, T.M. Aide, A.M.A. Zambrano and P. Balvanera et al., 2016. Biomass resilience of Neotropical secondary forests. Nature, 530: 211-214.
- Poorter, L., M.T. van der Sande, E.J.M.M. Arets, N. Ascarrunz and B.J. Enquist et al., 2017. Biodiversity and climate determine the functioning of Neotropical forests. Global Ecol. Biogeogr., 26: 1423-1434.
How to Cite this paper?
APA-7 Style
Bati,
Y., Nkongolo,
N.V., Angbandima,
B., Risasi,
E., N’shimba,
S. (2025). Comparative Analysis of Floristic Diversity in Primary and Secondary Forests at the IFA–Yangambi Experimental Plot, Ituri Forest, D.R. Congo. Trends in Agricultural Sciences, 4(4), 350-366. https://doi.org/10.17311/tas.2025.350.366
ACS Style
Bati,
Y.; Nkongolo,
N.V.; Angbandima,
B.; Risasi,
E.; N’shimba,
S. Comparative Analysis of Floristic Diversity in Primary and Secondary Forests at the IFA–Yangambi Experimental Plot, Ituri Forest, D.R. Congo. Trends Agric. Sci 2025, 4, 350-366. https://doi.org/10.17311/tas.2025.350.366
AMA Style
Bati
Y, Nkongolo
NV, Angbandima
B, Risasi
E, N’shimba
S. Comparative Analysis of Floristic Diversity in Primary and Secondary Forests at the IFA–Yangambi Experimental Plot, Ituri Forest, D.R. Congo. Trends in Agricultural Sciences. 2025; 4(4): 350-366. https://doi.org/10.17311/tas.2025.350.366
Chicago/Turabian Style
Bati, Yakoso, Nsalambi V. Nkongolo, Bilima Angbandima, Etutu Risasi, and Seya N’shimba.
2025. "Comparative Analysis of Floristic Diversity in Primary and Secondary Forests at the IFA–Yangambi Experimental Plot, Ituri Forest, D.R. Congo" Trends in Agricultural Sciences 4, no. 4: 350-366. https://doi.org/10.17311/tas.2025.350.366

This work is licensed under a Creative Commons Attribution 4.0 International License.