Evaluation and Selection of Advanced Arabica Coffee Lines in Horo Guduru Wollega, Western Ethiopia
-
Dawit Merga


Department of Coffee Breeding and Genetics, Ethiopian Institute of Agricultural Research, Jimma Agricultural Research Center, Jimma, Ethiopia
Lemi BeksisaDepartment of Coffee Breeding and Genetics, Ethiopian Institute of Agricultural Research, Jimma Agricultural Research Center, Jimma, Ethiopia
Desalegn AlemayehuDepartment of Coffee Breeding and Genetics, Ethiopian Institute of Agricultural Research, Jimma Agricultural Research Center, Jimma, Ethiopia
Mehammedsani ZakirDepartment of Coffee Breeding and Genetics, Ethiopian Institute of Agricultural Research, Jimma Agricultural Research Center, Jimma, Ethiopia
Asfaw AdugnaDepartment of Coffee Breeding and Genetics, Ethiopian Institute of Agricultural Research, Jimma Agricultural Research Center, Jimma, Ethiopia
Fekadu TeferaDepartment of Coffee Breeding and Genetics, Ethiopian Institute of Agricultural Research, Jimma Agricultural Research Center, Jimma, Ethiopia
Melaku AddisuDepartment of Coffee Breeding and Genetics, Ethiopian Institute of Agricultural Research, Jimma Agricultural Research Center, Jimma, Ethiopia
Mebrate KidaneDepartment of Coffee Breeding and Genetics, Ethiopian Institute of Agricultural Research, Jimma Agricultural Research Center, Jimma, Ethiopia
Admikew GetanehDepartment of Coffee Breeding and Genetics, Ethiopian Institute of Agricultural Research, Jimma Agricultural Research Center, Jimma, Ethiopia
Dula GenetiDepartment of Coffee Breeding and Genetics, Ethiopian Institute of Agricultural Research, Jimma Agricultural Research Center, Jimma, Ethiopia
| Received 22 May, 2025 |
Accepted 03 Jul, 2025 |
Published 31 Dec, 2025 |
Background and Objective: The demand for Arabica coffee in developed and developing countries is exponentially increasing. Arabica coffee is the spinal cord of the Ethiopian economy, and it is the leading commodity in generating foreign exchange income. Hence, this study was conducted to evaluate Arabica coffee accessions of Horro Guduru Wollega and to select advanced lines for the next breeding program. Materials and Methods: The experiment was established at Melko in 2016/2017 using an augmented design with three blocks. Twenty-five accessions and four checks were included in the study. Three representative coffee trees were randomly selected per plot for growth data recording, and the yield data for each coffee genotype were recorded per plot. Four years of clean coffee yield and nine yield-related traits data were recorded and analyzed using R software. Results: The present findings manifested the existence of variability among testing materials in some harvesting seasons and yield-related traits. Even though the pooled mean of clean coffee yield showed a non-significant difference, about 12 accessions showed comparable yield performance with the check, which were released for the south-southwestern areas. The top twelve high yielders showed 1741.68 to 2414.33 kg/ha mean yield performance. Conclusion: In general, these advanced lines were selected and recommended to be further evaluated for yield, yield-related, and quality under well-managed and uniform plots at representative locations of their original areas.
| Copyright © 2025 Merga et al. This is an open-access article distributed under the Creative Commons Attribution License, which permits unrestricted use, distribution, and reproduction in any medium, provided the original work is properly cited. |
INTRODUCTION
Coffee is the second-leading commodity in the world market after fuel. It is one of the most widely consumed beverages worldwide1. Among the 124 identified coffee species2, Arabica coffee is the dominant species in production3,4, and in customer preference globally5 . It accounts for up to 65% of the total world coffee production6.
The coffee market is growing due to the increasing interest in and culture of coffee consumption among the populations of developed countries such as Italy, the United States, Japan, China, the Philippines, and India7,8. Additionally, the rise of small coffee houses and coffee pot market businesses in developing countries like Ethiopia is another contributing factor to the growth of the coffee market. Furthermore, the various health benefits of coffee consumption, such as reducing the risk of diabetes, burning fat, and boosting energy through caffeine, are significant drivers of market growth9.
Ethiopia is the fifth-largest coffee producer in the world and the largest in Africa. In Ethiopia, Arabica coffee accounts for 30-35% of the total foreign exchange income generated by commodities10,11. In the 2023/2024 fiscal year, Ethiopia exported a total volume of 298,500 ton to the global market and earned USD 1.43 billion in revenue from coffee exports. This demonstrates that coffee’s contribution to the country’s economy is very high relative to other commodities. Additionally, about 25% of Ethiopians’ livelihoods depend directly or indirectly on coffee12,13. The growing demand for Arabica coffee at both the national and international levels underscores the need to increase production, enhance productivity, and develop advanced technologies.
Despite its unrepresentative importance, coffee production and productivity are below expectations. The average national coffee productivity is 650 kg/ha, which is extremely low14. Additionally, inconsistent production has been observed from year to year, creating challenges for small-scale livelihoods, the country’s annual income, and the coffee industry in general15,16. To address these problems effectively, yield improvement, the development of climate-smart varieties, and the application of appropriate field management technologies are key factors.
Some Ethiopian coffee-producing agro-ecologies still lack improved coffee varieties. The Horo Guduru Wollega Zone, well known for its quality coffee production, is among the coffee-producing areas that lack improved varieties. This area is characterized by diverse garden and semi-forest coffee production systems. However, small-scale farmers in the region rely on their cultivars, which are not experimentally certified. This leads to the use of low-yielding cultivars that are uncertified in quality, poorly adapted to the environment, and susceptible to diseases and abiotic stresses. To address these challenges, various accessions were collected from the Horo Guduru Zone and evaluated for yield and yield-related traits over eight years. This study was conducted to characterize and evaluate Arabica coffee accessions from Horo Guduru Wollega and to select advanced lines for the next breeding program.
MATERIALS AND METHODS
Study area: The experiment was conducted at the Jimma Agricultural Research Center (JARC). The JARC is located 10 km from Jimma City and 364 km from Addis Ababa, the capital city of Ethiopia. It is found at 1753 m.a.s.l., and at 7°40'00"N and 36°47'00"E direction. The area receives 1572 mm annual rainfall with 11.6 and 26.3°C minimum and maximum temperatures, respectively. The area is well known for its edaphic and climatic conditions, suitability for coffee production. The soil of the area is characterized as Nitosols, red and well-drained, with a pH of 4.37-6, and medium to high in CEC (cation exchange capacity).
Plant materials and experimental design: A total of twenty-five coffee accessions were collected in 2015 from the Horro Guduru Wollega Zone and its surroundings (Table 1). These accessions were collected from different gardens and semi-forest coffee production systems. However, one accession (Ab5) completely vanished during the early time after two years of field planting due to its poor performance during field evaluation. Thus, 24 accessions and 4 checks, a total of 28 coffee genotypes, were involved in this study. The field experiment was established in 2016 using an augmented design with three blocks. Tested materials were not replicated, but checks were replicated in an incomplete block following the augmented design principle. Augmented design was used due to a lack of seeds. Six coffee trees were planted per plot with a spacing of 2×2 m between coffee trees and plots. Field management practices like shade, mulching, weeding, fertilizer, and coffee trees management were applied following standard procedure or recommendation17.
| Table 1: | Data passport of coffee accessions | |||
| Sr. No. | Accession code | Region | Zone | Woreda | Specific location | Alt (m.a.s.l.) |
| 1 | Abe01/015 | Oromia | H/Guduru | Abedongoro | Chokorsa | 1730 |
| 2 | Abe02/015 | Oromia | H/Guduru | Abedongoro | Lage | - |
| 3 | Abe03/015 | Oromia | H/Guduru | Abedongoro | Lage | 1730 |
| 4 | Abe04/015 | Oromia | H/Guduru | Abedongoro | Lage | 170 |
| 5 | Abe05/015 | Oromia | H/Guduru | Abedongoro | Lage | 1730 |
| 6 | Abe06/015 | Oromia | H/Guduru | Abedongoro | Lafoni | 1742 |
| 7 | Abe07/015 | Oromia | H/Guduru | Abedongoro | Lafoni | 1742 |
| 8 | Abe08/015 | Oromia | H/Guduru | Abedongoro | Lafoni | 1765 |
| 9 | Abe09/015 | Oromia | H/Guduru | Abedongoro | Sadeka | 1765 |
| 10 | Abe10/015 | Oromia | H/Guduru | Abedongoro | Sadeka | 1765 |
| 11 | Abe11/015 | Oromia | H/Guduru | Abedongoro | LaftoJafafa | 1740 |
| 12 | Abe12/015 | Oromia | H/Guduru | Abedongoro | LaftoJafafa | 1740 |
| 13 | Abe13/015 | Oromia | H/Guduru | Abedongoro | Kesadi | - |
| 14 | Abe14/015 | Oromia | H/Guduru | Abedongoro | - | - |
| 15 | Abe15/015 | Oromia | H/Guduru | Abedongoro | - | - |
| 16 | Abe16/015 | Oromia | H/Guduru | Abedongoro | Harbu | - |
| 17 | Abe17/015 | Oromia | H/Guduru | Abedongoro | Harbu | - |
| 18 | Abe18/015 | Oromia | H/Guduru | Abedongoro | - | - |
| 19 | Abe19/015 | Oromia | H/Guduru | Abedongoro | Lubuqici | - |
| 20 | Abe20/015 | Oromia | H/Guduru | Abedongoro | Haleli | - |
| 21 | Abe21/015 | Oromia | H/Guduru | Abedongoro | Lage | - |
| 22 | Abe22/015 | Oromia | H/Guduru | Abedongoro | - | - |
| 23 | Abe23/015 | Oromia | H/Guduru | Abedongoro | - | - |
| 24 | Abe24/015 | Oromia | H/Guduru | Abedongoro | - | - |
| 25 | Abe25/015 | Oromia | H/Guduru | Abedongoro | - | 1650 |
| Checks | ||||||
| 1 | 74110 | |||||
| 2 | 744 | |||||
| 3 | Dessu | |||||
| 4 | 75227 |
Data recorded: Three representative coffee trees were randomly selected for growth data recording, and the yield data were recorded per plot18. Major growth parameters data such as plant height, node number of main stem, height up to the first primary branch, length of the first primary branch, girth (main stem diameter), number of primary branch, number of bearing primary branch, number of secondary branch and canopy diameter were recorded at the cherry maturity stage. Three representative sample coffee trees were taken per plot, and growth data were recorded. For yield data, fresh red cherries were recorded per plot and converted to clean bean coffee yield, which was expressed in kg/ha. The yield data were recorded for four consecutive years.
Data analysis: All growth and yield data were subjected to R-software version 4.3.3 for further statistical analysis19. Before carrying out further data analysis, data uniformity was tested for each parameter. A random model was used to compute the variability among the tested materials.
The following statistical random model was used to estimate phenotypic variability in quantitative traits:
where, yij is the phenotypic value for the genotype i and block j, μ is the population mean, gi is the random genotypic effect, bk is the effect of kth block, and and εij is the random effect of residuals.
The significant difference among genotypes was tested at a 5% probability level (p<0.05). The mean separation among genotypes was tested using the critical difference (CD). Genetic parameters such as phenotypic variability (PV), genetic variability (GA), genotypic coefficient of variation (GCV), phenotypic coefficient of variation (PCV), genetic gain (GA), genetic gain as percentage of mean (GAM) and broad sense heritability (HBS) were computed according to Johnson et al.20 and Janick21.
Components of variance: Genotypic (σ2g), error (σ2e), and phenotypic (σ2p) variance were computed as follows:
Where:
| Mse | = | Mean square of error |
| σ2g | = | (Msg-Mse)/r |
| Msg | = | Mean square of genotypes |
| r | = | Replication |
and:
Broad sense heritability: Calculated as follows:
where, σ2g is genotypic variance and σ2p is phenotypic variance; Heritability was classified as low (0-20%), moderate (20-50%), and high (>50%).
Estimation of expected genetic advance: Calculated as:
Where:
| GA | = | Expected genetic advance |
| σp | = | phenotypic standard deviation |
| Hb2 | = | Heritability in the broad sense |
| K | = | Selection differential (K = 2.06 at 5% selection intensity) |
Genetic advance as a percent of mean:
where, GA and X represent genetic advance and sample mean, respectively; GAM was categorized as low (0-10%), moderate (10-20%), and high (>20%).
Phenotypic and genotypic coefficient of variation: Computed as follows:
and:
where, GCV is genotypic coefficient of variance, PCV is phenotypic coefficient of variance, and x is general mean; PCV and GCV categorized as low (0-10%), moderate (10-20%), and high (>20%).
RESULTS
Yield performance of coffee genotypes: Variability was revealed among testing materials in yield performance in some years. Highly significant difference (p<0.01) was tested among the whole treatments and tested materials (augmented treatments) in 2020/2021 year; in 2020/2021 and 2022/2023 harvesting seasons, significant difference (p<0.05) was observed between tested materials and checks (Table 1 and Appendix Table 1). Despite the high yield gap recorded among testing materials, the pooled mean clean coffee yield of over four years showed statistically non-significant differences among treatments. The yield performance of coffee accessions ranged from 2416.33 to 1122.92 kg/ha, which showed a twofold difference between high and low performing coffee genotypes (Appendix Table 1).
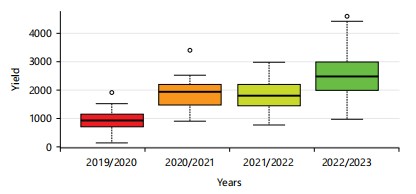
The combined yield of all genotypes revealed the highest yield record in the 2022/2023 harvesting season (Fig. 1). The lowest clean coffee yield was recorded during the early season (2019/2020). In the 2020/2021 and 2021/2022 harvesting seasons, almost all the same mean clean yields were recorded.
| Appendix Table 1: | Mean of clean coffee yield (kg/ha) from 2019/2020-2022/2023 harvesting seasons | |||
| Genotypes | 2019/2020 | 2020/2021 | 2021/2022 | 2022/2023 | Mean |
| Abe1 | 509.55 | 1129.23 | 1321.51 | 1737.37 | 1174.41 |
| Abe10 | 1733.19 | 2113.08 | 2132.96 | 2150.72 | 2032.48 |
| Abe11 | 697.64 | 3220.35 | 2822.39 | 2924.95 | 2416.33 |
| Abe12 | 937.41 | 1828.4 | 1690.94 | 1788.21 | 1561.24 |
| Abe13 | 1305.76 | 1800.05 | 1749.32 | 3613 | 2117.03 |
| Abe14 | 1406.54 | 1994.37 | 3003.1 | 2191.03 | 2148.76 |
| Abe15 | 1118.11 | 1729.71 | 1899.44 | 3352.38 | 2024.91 |
| Abe16 | 1706.5 | 2274.43 | 2308.1 | 1558.58 | 1961.9 |
| Abe17 | 1093.09 | 1729.49 | 1732.63 | 869.14 | 1356.09 |
| Abe18 | 853.49 | 1903.2 | 406.96 | 1580.16 | 1185.95 |
| Abe19 | 313.47 | 1654.22 | 2221.74 | 3177.27 | 1841.68 |
| Abe2 | 632.57 | 1597.6 | 1324.29 | 2252.37 | 1451.71 |
| Abe20 | 733.6 | 1549.14 | 2088.86 | 3011.86 | 1845.87 |
| Abe21 | 638.04 | 2162.3 | 1791.4 | 2853.4 | 1861.28 |
| Abe22 | 770.09 | 1196.52 | 1082.5 | 1442.55 | 1122.92 |
| Abe23 | 1103.69 | 2575.96 | 2619.84 | 1773.37 | 2018.21 |
| Abe24 | 669.31 | 1497.32 | 2204.23 | 2587.91 | 1739.69 |
| Abe25 | 997.35 | 2517.86 | 1924.84 | 3711.03 | 2287.77 |
| Abe3 | 832.73 | 1440.31 | 1810.23 | 2207.75 | 1572.75 |
| Abe4 | 436.58 | 1369 | 1146.37 | 1910.01 | 1215.49 |
| Abe6 | 994.31 | 1389.43 | 1641.21 | 2065.41 | 1522.59 |
| Abe7 | 1103.78 | 1154.25 | 2389.03 | 1341.22 | 1497.07 |
| Abe8 | 754.54 | 1958.22 | 2193.04 | 2574.71 | 1870.13 |
| Abe9 | 978.68 | 1628.63 | 1504.99 | 1562.23 | 1418.63 |
| Dessu | 1400.89 | 2134.58 | 1751.86 | 3485.66 | 2193.25 |
| 74110 | 506.77 | 1319.04 | 2034.13 | 2466.55 | 1581.62 |
| 744 | 1307.87 | 2269.96 | 1815.8 | 3410.36 | 2201 |
| 75227 | 725.23 | 2216.15 | 1466.77 | 3183.05 | 1897.8 |
| Mean | 937.88 | 1834.03 | 1859.94 | 2385.08 | 1754.23 |
| CV (%) | 36 | 10.61 | 27.34 | 35 | 24.87 |
| Ci-Cj | 682.21* | 396.01** | 1004.82 | 1784.37 | 895.45 |
| BiVi-BiVji | 1321.09 | 766.86** | 1945.83 | 3455.42 | 1734.03 |
| Vi-Vj | 1181.62 | 685.90** | 1740.4 | 3090.62 | 1550.96 |
| Ci-Vj | 1078.66 | 626.14* | 1588.76 | 2821.34* | 1415.83 |
| CV: Coefficient of variation, CD: Critical difference, Ci-Cj: Between two control treatments, BiVi-BiVj: Between two augmented treatments, Vi-Vj: Between two treatments and Ci-Vj: Between control treatment and augmented treatment | |||||
The mean yield performance trends across years for each coffee genotype are indicated in Fig. 1 and Appendix Table 1. Almost all coffee genotypes showed low yield performance during the first two harvesting seasons (2019/2020 and 2020/2022). The biennial bearing characteristic was revealed by coffee genotypes. The insignificant mean yield difference was observed between 2020/2021 and 2021/2022 harvesting seasons (Fig. 1). For most coffee genotypes, high fruits bearing were observed in the 2022/2023; but, the lowest crop load was recorded in the 2019/2020 harvesting season (Fig. 1 and Appendix Table 1).
Performance in growth characteristics: Significant difference (p<0.05) was observed among augmented coffee accessions and all genotypes in main stem girth and plant height (Table 2). Highly significant variable (p<0.01) was detected between augmented accessions and checks in plant height; whereas, between augmented accessions and checks, significantly different performance was recorded in the number of bearing primary branches and the number of nodes per main stem. The performance of coffee genotypes ranged from 166.58 to 271.00 cm in plant height and 29.30 to 55.40 mm in main stem girth. Also, about 25 to 46 and 19 to 55 performance differences in the number of nodes on the main stem and the number of bearing primary branch were recorded among genotypes, respectively (Table 2).
| Table 2: | Mean performances of coffee genotypes in growth parameters | |||
| Genotypes | CD | G | HUFPB | LFPB | NBPB | NNM | NPB | NSB | PH | Yield |
| Abe1 | 199.07 | 41.19 | 31 | 78.67 | 33.03 | 34.53 | 66.69 | 92.03 | 213.75 | 1174.41 |
| Abe10 | 154.19 | 33.29 | 23.92 | 67.42 | 19.44 | 25.11 | 47.94 | 66.03 | 166.58 | 2032.48 |
| Abe11 | 172.03 | 35.22 | 32.25 | 84.08 | 28.78 | 24.78 | 41.94 | 89.03 | 192.58 | 2416.33 |
| Abe12 | 206.69 | 36.07 | 31.58 | 87.42 | 25.44 | 28.11 | 53.94 | 119.36 | 206.92 | 1561.24 |
| Abe13 | 167.03 | 32.75 | 33.58 | 67.08 | 27.44 | 28.11 | 55.28 | 87.69 | 218.58 | 2117.03 |
| Abe14 | 190.86 | 29.3 | 32.58 | 87.42 | 28.11 | 31.44 | 58.94 | 105.69 | 218.58 | 2148.76 |
| Abe15 | 200.94 | 31.81 | 34.08 | 84.25 | 38.11 | 25.44 | 49.61 | 88.53 | 199.42 | 2024.91 |
| Abe16 | 160.86 | 31.99 | 27.58 | 72.08 | 23.11 | 30.78 | 58.94 | 124.03 | 176.92 | 1961.9 |
| Abe17 | 165.53 | 44.25 | 32.25 | 141.08 | 31.44 | 29.11 | 60.28 | 103.69 | 225.58 | 1356.09 |
| Abe18 | 186.57 | 39.38 | 24.42 | 69.58 | 33.86 | 34.69 | 64.03 | 93.94 | 236.67 | 1185.95 |
| Abe19 | 199.57 | 42.03 | 24.75 | 70.58 | 27.19 | 32.69 | 60.36 | 54.61 | 234 | 1841.68 |
| Abe2 | 209.57 | 50.76 | 32.3 | 104.37 | 32.03 | 34.86 | 69.03 | 139.36 | 238.08 | 1451.71 |
| Abe20 | 178.57 | 45.56 | 17.42 | 59.58 | 25.53 | 29.36 | 56.03 | 50.28 | 198 | 1845.87 |
| Abe21 | 209.4 | 55.07 | 24.75 | 97.25 | 31.53 | 33.69 | 64.36 | 133.61 | 261.67 | 1861.28 |
| Abe22 | 193.57 | 51.93 | 24.75 | 75.92 | 54.19 | 37.36 | 77.69 | 127.61 | 266.67 | 1122.92 |
| Abe23 | 193.57 | 48.39 | 25.75 | 78.92 | 32.53 | 34.03 | 64.36 | 104.28 | 235 | 2018.21 |
| Abe24 | 178.74 | 51.73 | 18.08 | 67.25 | 40.86 | 39.69 | 77.36 | 114.28 | 271 | 1739.69 |
| Abe25 | 161.24 | 49.19 | 23.42 | 75.58 | 37.19 | 38.03 | 74.36 | 155.94 | 226.33 | 2287.77 |
| Abe3 | 194.57 | 45.33 | 29 | 98.33 | 34.36 | 36.19 | 70.69 | 61.03 | 254.75 | 1572.75 |
| Abe4 | 207.74 | 55.4 | 37 | 75.33 | 44.03 | 36.19 | 70.69 | 61.03 | 260.42 | 1215.49 |
| Abe6 | 209.4 | 51.11 | 33 | 93 | 39.69 | 36.19 | 50.69 | 98.69 | 265.75 | 1522.59 |
| Abe7 | 207.74 | 45.21 | 29.33 | 87.67 | 29.03 | 27.53 | 55.36 | 70.36 | 224.75 | 1497.07 |
| Abe8 | 200.24 | 52.95 | 34.33 | 82 | 32.36 | 46.19 | 62.03 | 126.03 | 236.42 | 1870.13 |
| Abe9 | 173.57 | 45.42 | 30 | 94 | 25.36 | 28.53 | 57.03 | 88.69 | 205.75 | 1418.63 |
| Checks | ||||||||||
| Dessu | 180.83 | 40.94 | 28.44 | 68.33 | 26 | 31.44 | 60.78 | 72.44 | 224 | 2193.25 |
| 74110 | 168.28 | 41.2 | 37 | 86 | 22.89 | 25.67 | 50.11 | 65.22 | 192.56 | 1581.62 |
| 744 | 175.94 | 42.31 | 29.33 | 71.44 | 29 | 30.56 | 57.89 | 100 | 202.56 | 2201 |
| 75227 | 194.72 | 45.67 | 29.89 | 75.56 | 27.22 | 31.11 | 59.33 | 91.11 | 221.22 | 1897.8 |
| Mean | 186.47 | 43.41 | 28.99 | 82.15 | 31.42 | 32.19 | 60.56 | 95.88 | 224.09 | 1754.23 |
| CV (%) | 8.66 | 4.55 | 22.14 | 14.07 | 15.75 | 8.87 | 11.01 | 25.27 | 4.5 | 24.87 |
| Ci-Vj(CD5 | 50.61 | 6.22 | 20.61 | 35.84 | 15.07* | 8.86* | 20.79 | 74.12 | 31.44** | 1415.83 |
| BiVi-BiVj (CD5%) | 61.98 | 7.62* | 25.24 | 43.89 | 18.45 | 10.85 | 25.46 | 90.78 | 38.50* | 1734.03 |
| Vi-Vj (CD5%) | 55.44 | 6.81* | 22.5 | 39.26 | 16.5 | 9.71 | 22.77 | 81.2 | 34.44* | 1550.96 |
| Ci-Cj (CD5%) | 32.01 | 3.93 | 13.04 | 22.67 | 9.53 | 5.6 | 13.15 | 46.88 | 19.88* | 895.45 |
| CV: Coefficient of variation, CD: Critical difference, Ci-Cj: Between two control treatments, BiVi-BiVj: Between two augmented treatments, Vi-Vj: Between two treatments, Ci-Vj: Between control treatment and augmented treatment, *p<0.05 and **p<0.01, respectively. NB: Those that didn’t mark either by * or ** were non-significant. PH: Plant height, NNM: Node number of main stem, HUFPB: Height up to the first primary branch, LFPB: length of the first primary branch, G: Girth, NPB: Number of primary branch, NBPB: Number of bearing primary branch, NSB: number of secondary branch and CD: Canopy diameter | ||||||||||
|
| Table 3: | Estimates of genetic parameters for different traits | |||
| Traits | Mean | PV | GV | EV | GCV | GCV Category |
PCV | PCV category |
ECV | Hb | Hb category |
GA |
| PH | 224.09 | 546.45 | 447.42 | 99.03 | 9.44 | Low | 10.43 | Medium | 4.44 | 81.88 | High | 39.49 |
| HUFPB | 28.99 | 10.29 | 42.57 | 11.06 | Medium | 22.5 | ||||||
| G | 43.41 | 25.12 | 21.24 | 3.87 | 10.62 | Medium | 11.55 | Medium | 4.53 | 84.58 | High | 8.74 |
| LFPB | 82.15 | 242.1 | 113.38 | 128.72 | 12.96 | Medium | 18.94 | Medium | 13.81 | 46.83 | Medium | 15.03 |
| NPB | 60.56 | 53 | 9.71 | 43.29 | 5.15 | Low | 12.02 | Medium | 10.86 | 18.32 | Low | 2.75 |
| NBPB | 31.42 | 45.4 | 22.65 | 22.74 | 15.15 | Medium | 21.44 | High | 15.18 | 49.9 | Medium | 6.94 |
| NSB | 95.88 | 866.36 | 315.77 | 550.59 | 18.53 | Medium | 30.7 | High | 24.47 | 36.45 | Medium | 22.13 |
| NNM | 32.19 | 16.61 | 8.74 | 7.87 | 9.18 | Low | 12.66 | Medium | 8.71 | 52.62 | Medium | 4.42 |
| CD | 186.47 | 244.94 | 256.67 | 8.39 | Low | 8.59 | ||||||
| YIELD | 1754.2 | 141599.2 | 200880 | 21.45 | High | 25.55 | ||||||
| PH: Plant height (cm), NNM: Node number of main stem, HUFPB: Height up to the first primary branch (cm), LFPB: Length of the first primary branch (cm), G: Girth (mm), NPB: Number of primary branch, NBPB: Number of bearing primary branch, NSB: Number of secondary branch and CD: Canopy diameter (cm), PV: Phenotypic variability, GA: Genetic variability, GCV: Genotypic coefficient of variation, EV: Environmental variability, ECV: Environmental coefficient of variation, PCV: Phenotypic coefficient of variation, GA: Genetic gain, GAM: Genetic gain as percentage of mean and HB: Broad sense heritability, NB: |
||||||||||||
Genetic components of yield and yield-related traits: Almost all traits exhibited moderate genetic diversity (10-20%). However, plant height, number of nodes per primary branch, and number of primary branches showed low genetic coefficient of variation (GCV) (<10%) (Table 3). Except for canopy diameter, all traits showed moderate (10-20%) to high (>20%) phenotypic coefficient of variation (PCV). High broad-sense heritability (hSB) (>60%) was recorded for plant height and stem girth. Whereas, agronomic traits such as node number of main stem (NNM), length of the first primary branch (LFPB), number of bearing primary branches (NBPB), and number of secondary branches (NSB) exhibited medium hBS. Negative genetic variability (GV) was detected for traits such as height up to the first primary branch (HUFPB), canopy diameter (CD), and yield, which leads to not applicable (NA) for genetic parameters. The observed negative value may be due to high environmental or a greater magnitude of environmental contribution in phenotypic value than genetic value.
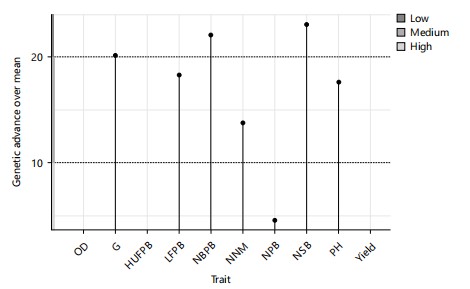
High genetic advance over mean (GAM) (>20%) was recorded for main stem girth (G), number of bearing primary branches (NBPB), and Number of secondary branches (Fig. 2). Length of the first primary branch, number of nodes per main stem, and plant height were exhibited medium GAM (10-20%).
Advanced line selection: Even though a non-significant difference was depicted among the tested, between the tested vs checks in most years, some genotypes showed high-yielding potential. Twelve pipelines exhibited comparable performance with high-yielding checks in pooled mean yield (Table 4). The highest yield, 2416.33 kg/ha was recorded by Abe11. This genotype showed a 215.33 kg/ha yield advantage over the best check 744. Also, pipelines such as Abe10, Abe13, Abe14, Abe15, Abe23, and Abe25 showed 2018.21-2287.77 kg/ha in the mean of clean coffee yield over four years. Other lines such as Abe16, Abe19, Abe20, Abe21, and Abe8 yielded performance ranging from 1861.28-1961.90 kg/ha.
|
| Table 4: | Top twelve high-yielding coffee accessions in clean coffee yield (kg/ha) | |||
| Genotypes | 2019/2020 | 2020/2021 | 2021/2022 | 2022/2023 | Mean |
| Abe10 | 1733.19 | 2113.08 | 2132.96 | 2150.72 | 2032.48 |
| Abe11 | 697.64 | 3220.35 | 2822.39 | 2924.95 | 2416.33 |
| Abe13 | 1305.76 | 1800.05 | 1749.32 | 3613 | 2117.03 |
| Abe14 | 1406.54 | 1994.37 | 3003.1 | 2191.03 | 2148.76 |
| Abe15 | 1118.11 | 1729.71 | 1899.44 | 3352.38 | 2024.91 |
| Abe16 | 1706.5 | 2274.43 | 2308.1 | 1558.58 | 1961.9 |
| Abe19 | 313.47 | 1654.22 | 2221.74 | 3177.27 | 1841.68 |
| Abe20 | 733.6 | 1549.14 | 2088.86 | 3011.86 | 1845.87 |
| Abe21 | 638.04 | 2162.3 | 1791.4 | 2853.4 | 1861.28 |
| Abe23 | 1103.69 | 2575.96 | 2619.84 | 1773.37 | 2018.21 |
| Abe25 | 997.35 | 2517.86 | 1924.84 | 3711.03 | 2287.77 |
| Abe8 | 754.54 | 1958.22 | 2193.04 | 2574.71 | 1870.13 |
| Checks | |||||
| Dessu | 1400.89 | 2134.58 | 1751.86 | 3485.66 | 2193.25 |
| 74110 | 506.77 | 1319.04 | 2034.13 | 2466.55 | 1581.62 |
| 744 | 1307.87 | 2269.96 | 1815.8 | 3410.36 | 2201 |
| 75227 | 725.23 | 2216.15 | 1466.77 | 3183.05 | 1897.8 |
| Mean | 937.88 | 1834.03 | 1859.94 | 2385.08 | 1754.23 |
| CV (%) | 36 | 10.61 | 27.34 | 35 | 24.87 |
| Ci-Cj | 682.21* | 396.01** | 1004.82 | 1784.37 | 895.45 |
| BiVi-BiVji | 1321.09 | 766.86** | 1945.83 | 3455.42 | 1734.03 |
| Vi-Vj | 1181.62 | 685.90** | 1740.4 | 3090.62 | 1550.96 |
| Ci-Vj | 1078.66 | 626.14* | 1588.76 | 2821.34* | 1415.83 |
| CV: Coefficient of variation, CD: Critical difference, Ci-Cj: Between two control treatments, BiVi-BiVj: Between two augmented treatments, Vi-Vj: Between two treatments and Ci-Vj: Between control treatment and augmented treatment | |||||
DISCUSSION
Genetic variability was exhibited among testing materials in yield and agronomic traits. In agreement, some scholars confirmed the existence of variability among Arabica coffee accessions in yield performance15,22-25. Despite a high yield gap recorded among testing materials, the pooled mean clean coffee yield of over four years showed statistically non-significant differences among treatments. The yield performance of coffee accessions ranged from 2416.33 to 1122.92 kg/ha, which showed twofold difference between high and low performed coffee genotypes (Appendix Table 1).
The biennial bearing characteristic was revealed by coffee genotypes. High bearing of cherries was exhibited in 2020/2021 and 2022/2023 harvesting seasons; but in 2019/2020 and 2021/2022 low bearing was recorded. In line with this, findings confirmed that the availability of yield bienniality characteristic of Arabica coffee15,26-29.
Variability was manifested among augmented treatment, whole treatment and between augmented treatments and checks in some agronomic traits (Table 2). This implies that the possibility to select best performing promising line using indices traits. Similarly, Gebreselassie et al.30 reported variability among Arabica coffee genotypes in morphological traits. Findings realized that yield-related traits are among the indicators for selection of high yielding coffee genotypes23,31.
Lateral branches such as a number of primary branches and secondary branches, are among the indices traits for high yielding genotype selection. Under normal conditions, they are positively associated with clean coffee yield. Despite non-significant difference was revealed among augmented accessions and between augmented vs checks in a number of primary branch and secondary branch, 42 to 77 and 50 to 156 differences were recorded for the highest and lowest performed accessions, respectively. In agreement, different scholars confirmed the availability genetic diversity among Coffea arabica L. germplasms in Agronomic traits30,32-34.
Moderate genetic diversity was revealed among Arabica coffee genotypes in almost all agronomic traits. Number of secondary and number of bearing primary branches showed moderate GCV (10-20%) and high PCV (>20%); plant height and stem girth recorded high broad-sense heritability (>60%). Additionally, high genetic advance as a percentage of mean (GAM) (0.20%) was recoded for number of bearing primary branches (NBPB), stem girth and secondary branches. This elucidated that these traits can be used as indices for high yielder pipe line selection. Similarly, Atinafu et al.35 and Weldemichael et al.36 low to high GCV and PCV were recorded for Agro-morphological traits. In line with this, moderate broad-sense heritability was recorded for NSB, LFPB and NBPB23,31,37. Also, Atinafu et al.35 found medium value of hBS for NSB. Additionally, Akpertey et al.31 and Kitila et al.38 reported than high GAM in main stem diameter and number of secondary branch of Arabica coffee.
Low GAM (<10) was recorded for number of primary branch. This finding contradicts with the finding of Degefa et al.39, who reported moderate GCV in number of primary branch and low GAM in length of the first primary branch. The present findings depicted that if the top five high yielders are selected using over four mean yields, about 22 number of secondary can be improved per cycle of selection over population (Table 3); also, 39.49 cm genetic gain in plant height, 8.74 mm in main stem girth and 4 number of node per main stem can be obtained. As these traits have significant and strongly positive correlation with clean coffee yield31,40, they play momentous role for high yielding selection of Arabica coffee pipe lines.
About twelve promising lines were showed 2416.33 to 1841.68 kg/ha yield performance and relatively good in agronomic traits. The present results provided important insight as these lines have good yielding potential. Thus, taking them to their original location and testing over representative locations of coffee producing areas of Horo Guduru Zone may enable them to express their actual yield potential. Hence, selecting these twelve pipe line as advance line and testing them in uniform plot for further evaluation in yield, disease resistance and quality is momentous. In agreement, a total of 15 and 25 advanced lines were selected from 88 and 120 Arabica coffee accessions, respectively15,28.
CONCLUSION
A significant difference was tested among the augmented accessions in clean coffee yield for some harvesting seasons. Additionally, significantly variability was found in plant height, number of node per main stem and main stem girth. Twelve lines exhibited clean coffee yield performance ranging from 1841.68-2416.33 kg/ha, while Abe11 recorded a 215.33 kg/ha clean coffee yield improvement over best check 744. Therefore, these twelve lines are recommended for selection as advanced lines and further testing for yield, yield components, quality, and disease resistance across representative coffee-producing areas in the Horro Guduru.
SIGNIFICANCE STATEMENT
This study discovered the availability of genetic diversity among Arabica coffee accessions of Horro Guduru Wellega Origin. The findings highlight the selection of the best-performing pipeline to develop improved varieties for the locality. Accordingly, twelve promising lines of Arabica coffee were selected from the base population for further evaluation under the representative agroecology of the Horo Guduru District. These materials will help researchers as a genetic resource for coffee genetic improvement. The present findings will also be used by different scholars and the coffee industry.
ACKNOWLEDGMENT
The authors thank the Ethiopian Institute of Agricultural Research for financing the experiment; also, the authors highly appreciate Jimma Agricultural Research Center for its technical and logistic support during the field experiment. Additionally, the authors would like to appreciate the coffee breeding and genetics team for their inestimable support during data collection and their involvement in field experimental plots management starting from its establishment to the end of the experiment.
REFERENCES
- Alonso-Salces, R.M., F. Serra, F. Reniero and K. HÉberger, 2009. Botanical and geographical characterization of green coffee (Coffea arabica and Coffea canephora): Chemometric evaluation of phenolic and methylxanthine contents. J. Agric. Food. Chem., 57: 4224-4235.
- Davis, A.P., 2011. Psilanthus mannii, the type species of Psilanthus, transferred to Coffea. Nord. J. Bot., 29: 471-472.
- Krishnan, S., 2021. Coffee: Genetic Diversity, Erosion, Conservation, and Utilization. In: Cash Crops: Genetic Diversity, Erosion, Conservation and Utilization, Priyadarshan, P.M. and S.M. Jain (Eds.), Springer, Switzerland, ISBN: 978-3-030-74926-2, pp: 55-80.
- Belitz, H.D., W. Grosch and P. Schieberle, 2009. Coffee, Tea, Cocoa. In: Food Chemistry, Belitz, H.D., W. Grosch and P. Schieberle (Eds.), Springer, Berlin, Heidelberg, ISBN: 978-3-540-69934-7, pp: 938-970.
- Batista, L.R. S.M.C. de Souza, C.F. Silva e Batista and R.F. Schwan, 2016. Coffee: Types and Production. In: Encyclopedia of Food and Health, Caballero, B., P.M. Finglas and F. Toldrá (Eds.), Elsevier, Amsterdam, Netherlands, ISBN: 978-0-12-384953-3, pp: 244-251.
- Labouisse, J.P., B. Bellachew, S. Kotecha and B. Bertrand, 2008. Current status of coffee (Coffea arabica L.) genetic resources in Ethiopia: Implications for conservation. Genet. Resour. Crop E, 55: 1079-1093.
- Venkatesan, M., 2021. Social and Sustainability Marketing and the Sharing Economy in the Coffee Shop Culture. In: Social and Sustainability Marketing: A Casebook for Reaching Your Socially Responsible Consumers through Marketing Science, Bhattacharyya, J., M.K. Dash, C. Hewege, M.S. Balaji and W.M. Lim (Eds.), Productivity Press, New York, ISBN: 9781003188186, pp: 839-862.
- Coltri, P.P., H.S. Pinto, R.R. do Valle Gonçalves, J. Zullo Jr. and V. Dubreuil, 2019. Low levels of shade and climate change adaptation of Arabica coffee in Southeastern Brazil. Heliyon, 5.
- Torga, G.N. and E.E. Spers, 2020. Perspectives of Global Coffee Demand. In: Coffee Consumption and Industry Strategies in Brazil: A Volume in the Consumer Science and Strategic Marketing Series, de Almeida, L.F. and E.E. Spers (Eds.), Elsevier, Amsterdam, Netherlands, ISBN: 978-0-12-814721-4, pp: 21-49.
- Gizaw, N., J. Abafita and T.M. Merra, 2022. Impact of coffee exports on economic growth in Ethiopia; An empirical investigation. Cogent Econ. Finance, 10.
- Chelkeba, S.D., B. Erko and K. Fikirie, 2019. Production and adoption constraints of coffee improved varieties in Jimma Zone; Southwest Ethiopia. J. Sci. Agric., 3: 33-40.
- Worku, M., 2023. Production, productivity, quality and chemical composition of Ethiopian coffee. Cogent Food Agric., 9.
- Moat, J., J. Williams, S. Baena, T. Wilkinson and T.W. Gole et al., 2017. Resilience potential of the Ethiopian coffee sector under climate change. Nat. Plants, 3.
- Asfaw, E., 2024. The review article: Ethiopian coffee production trend analysis: Comparison with major coffee producing countries of the world. Int. J. Social Sci. Humanit. Invention, 11: 8234-8237.
- Merga, D., L. Beksisa, W. Merga and D. Alemayehu, 2023. Genetic variability of coffee (Coffea arabica L.) germplasm in biennial bearing and its influence on selection efficiency. Int. J. Agron., 2023.
- Merga, D. and D. Etana, 2023. Influences of salient agronomic practices for mitigation of biennial bearing in coffee (Coffea arabica L.). J. Plant Sci., 11: 136-143.
- Takala, B., 2023. Integrated nutrient management for improved coffee production at West and Southwest Ethiopia. A review. J. Environ. Earth Sci., 13.
- Mohammed, H., D. Merga and A. Ayano, 2022. Genotypic association between yield and yield related traits of some coffee (Coffea arabica L.) genotypes. Asian J. Biol. Sci., 15: 235-248.
- Ihaka, R. and R. Gentleman, 1996. R: A language for data analysis and graphics. J. Comput. Graphical Stat., 5: 299-314.
- Johnson, H.W., H.F. Robinson and R.E. Comstock, 1955. Genotypic and phenotypic correlations in soybeans and their implications in selection. Agron. J., 47: 477-483.
- Janick, J., 2002. Plant Breeding Reviews. John Wiley & Sons, Inc., New Jersey, ISBN: 9780470650202, Pages: 445.
- Ferreira, J.L., E.T. Caixeta, F.F. Caniato, T. Setotaw, G.C. Sant’Ana and L.M. Ferreira, 2020. Genetic Diversity of Coffea arabica. In: Genetic Variation, Maia, R. and M. de Araújo Campos (Eds.), IntechOpen, London, United Kingdom, ISBN: 978-1-83881-101-3, Pages: 298.
- Merga, D., H. Mohammed and A. Ayano, 2021. Estimation of genetic variability, heritability and genetic advance of some Wollega coffee (Coffea arabica L.) landrace in Western Ethiopia using quantitative traits. J. Plant Sci., 9: 182-191.
- Benti, T., E. Gebre, K. Tesfaye, G. Berecha, P. Lashermes, M. Kyallo and N.K. Yao, 2021. Genetic diversity among commercial Arabica coffee (Coffea arabica L.) varieties in Ethiopia using simple sequence repeat markers. J. Crop Improv., 35: 147-168.
- Gokavi, N., P.M. Gangadharappa, D. Sathish, S. Nishani, J.S. Hiremath and S. Koulagi, 2023. Genetic variability, heritability and genetic advance for quantitative traits of Arabica coffee (Coffea arabica L.) genotypes. Plant Genet. Resour., 21: 260-268.
- Akpertey, A., E. Anim-Kwapong and A. Ofori, 2018. Genetic variation among Robusta coffee genotypes for growth and yield traits in Ghana. J. Agric. Sci., 10: 138-149.
- Asefa, G., 2022. GGE biplot analysis of genotype by environment interaction and yield stability analysis of Arabica coffee (Coffea arabica L.) diallel genotypes in South Western Ethiopia. Global Sci. J., 10: 1082-1100.
- Merga, D., L. Beksisa, D. Alemayehu, F. Tefera and M. Adisu et al., 2022. Genetic gain trend in yield and advanced selection of Yayo coffee (Coffea arabica L.) land race collection. Adv. Agric., 2022.
- Merga, D., L. Beksisa, B. Girma, D. Alemayehu and A. Sualeh et al., 2024. Influence of biennial bearing on physical and organoleptic quality of Arabica coffee. Heliyon.
- Gebreselassie, H., B. Tesfaye and A. Gedebo, 2024. Genetic diversity of Arabica coffee genotypes in South Ethiopia using quantitative agro-morphological traits. Genet. Resour. Crop E, 71: 3485-3506.
- Akpertey, A., E. Anim-Kwapong, P.K.K. Adu-Gyamfi and A. Ofori, 2022. Genetic variability for vigor and yield of robusta coffee (Coffea canephora) clones in Ghana. Heliyon, 8.
- Kebede, M. and B. Bellachew, 2008. Phenotypic diversity in the Hararge coffee (Coffea arabica L) germplasm for quantitative traits. East Afr. J. Sci., 2: 13-18.
- Merga, D. and Z. Wubshet, 2021. Ethiopian coffee (Coffea arabica L.) germplasm genetic diversity: Implication in current research achievement and breeding program: Review. J. Agric. Res. Pestic. Biofertilizers, 1. 05.2021/1.1014.
- Alemayehu, D., 2023. The indicators of coffee (Coffea arabica L.) genetic variations and achievements made in coffee research in case of Ethiopia: Review. Innovation, 4: 29-34.
- Atinafu, G., H. Mohammed and T. Kufa, 2017. Genetic variability of sidama coffee (Coffea arabica L.) landrace for agro-morphological traits at Awada, Southern Ethiopia. Acad. Res. J. Agric. Sci. Res., 5: 263-275.
- Weldemichael, G., S. Alamerew and T. Kufa, 2017. Genetic variability, heritability and genetic advance for quantitative traits in coffee (Coffea arabica L.) accessions in Ethiopia. Afr. J. Agric. Res., 12: 1824-1831.
- Beksisa, L. and A. Ayano, 2016. Genetic variability, heritability and genetic advance for yield and yield components of limmu coffee (Coffea arabica L.) accessions in South Western Ethiopia. Middle-East J. Sci. Res., 24: 1913-1919.
- Kitila, O., S. Alamerew, T. Kufa and W. Garedew, 2011. Variability of quantitative traits in limmu coffee (Coffea arabica L.) in Ethiopia. Int. J. Agric. Res., 6: 482-493.
- Degefa, M., S. Alamerew, A. Mohammed and A. Gemechu, 2021. Variability of coffee (Coffea arabica L.) germplasm collections based on morphological quantitative characters. Agric. For. Fish., 10: 160-169.
- Merga, D., H. Mohammed and A. Ayano, 2019. Correlation and path coefficient analysis of quantitative traits in some Wollega coffee (Coffea arabica L.) landrace in Western Ethiopia. J. Environ. Earth Sci., 9: 1-8.
How to Cite this paper?
APA-7 Style
Merga,
D., Beksisa,
L., Alemayehu,
D., Zakir,
M., Adugna,
A., Tefera,
F., Addisu,
M., Kidane,
M., Getaneh,
A., Geneti,
D. (2025). Evaluation and Selection of Advanced Arabica Coffee Lines in Horo Guduru Wollega, Western Ethiopia. Trends in Agricultural Sciences, 4(4), 287-298. https://doi.org/10.17311/tas.2025.287.298
ACS Style
Merga,
D.; Beksisa,
L.; Alemayehu,
D.; Zakir,
M.; Adugna,
A.; Tefera,
F.; Addisu,
M.; Kidane,
M.; Getaneh,
A.; Geneti,
D. Evaluation and Selection of Advanced Arabica Coffee Lines in Horo Guduru Wollega, Western Ethiopia. Trends Agric. Sci 2025, 4, 287-298. https://doi.org/10.17311/tas.2025.287.298
AMA Style
Merga
D, Beksisa
L, Alemayehu
D, Zakir
M, Adugna
A, Tefera
F, Addisu
M, Kidane
M, Getaneh
A, Geneti
D. Evaluation and Selection of Advanced Arabica Coffee Lines in Horo Guduru Wollega, Western Ethiopia. Trends in Agricultural Sciences. 2025; 4(4): 287-298. https://doi.org/10.17311/tas.2025.287.298
Chicago/Turabian Style
Merga, Dawit, Lemi Beksisa, Desalegn Alemayehu, Mehammedsani Zakir, Asfaw Adugna, Fekadu Tefera, Melaku Addisu, Mebrate Kidane, Admikew Getaneh, and Dula Geneti.
2025. "Evaluation and Selection of Advanced Arabica Coffee Lines in Horo Guduru Wollega, Western Ethiopia" Trends in Agricultural Sciences 4, no. 4: 287-298. https://doi.org/10.17311/tas.2025.287.298

This work is licensed under a Creative Commons Attribution 4.0 International License.