Assessment of Adansonia digitata L. Aboveground Biomass and Carbon Storage in Blue Nile, North and West Kordofan State, Sudan
-
Nasreldin Abdelrahaman Gurashi
Department of Forest, Faculty of Natural Resources, University of Sinnar, 11147 Sinnar, Sudan
Muneer Elyas Siddig Eltahir
Department of Extension, Training and Documentation, Institute of Gum Arabic Research and Desertification Studies, University of Kordofan, 51111 El Obied, Sudan
| Received 28 Apr, 2025 |
Accepted 03 Jul, 2025 |
Published 31 Dec, 2025 |
Background and Objective: Woodlands cover large areas in South-Eastern and Central Africa. Basins need to increase levels of atmospheric carbon dioxide, which is directly linked to climate change. Baobab (Adansonia digitata L.) is among the vascular tree species with a long lifetime of over 1000 years; therefore, it has the potential for carbon storage. This research aimed to calculate aboveground biomass and carbon in the Blue Nile, North and West Kordofan States of Sudan. Materials and Methods: Baobab trees were identified, and the diameter of each tree was measured, and the crown width of the tree were measured. An allometric model was developed and used for estimating above-ground biomass of baobab trees in dry areas, with diameter at breast height only as the independent variable. Biomass was calculated as 50% carbon. Results: The mean aboveground biomass of baobabs, 5.96±2.76 ton/tree in Blue Nile, was higher than 3.67±1.67 and 5.06±3.04 ton/tree recorded in West and North Kordofan States, respectively. The whole experiment (three states) carbon density was 2.45±1.04 ton/ha. The aboveground carbon density of 2.98±1.34 in Blue Nile state was higher than 1.83±0.78 ton/ha recorded in West Kordofan State and 2.53±1.74 ton/ha in North Kordofan State. In the whole experiment (three states), carbon density was found 2.45±1.04 ton/ha following post hoc multiple comparisons (p<0.05). Wild stands of Baobab have great potential for carbon storage. Conclusion: It is supposed that some trees are over 1000 years old. Sustainable carbon storage in baobabs could be achieved by planting them in reserve areas rather than in an agroforestry system or in the wild. It will help reduce the atmospheric carbon dioxide concentrations.
| Copyright © 2025 Gurashi and Eltahir. This is an open-access article distributed under the Creative Commons Attribution License, which permits unrestricted use, distribution, and reproduction in any medium, provided the original work is properly cited. |
INTRODUCTION
Biomass of plants strongly affects the structure and function of the ecosystem. The biomass of forests accounts for 85-90% of terrestrial vegetation biomass. It was reported that forest biomass stock changes significantly from harvesting, land-use, climate variability, and disturbance1-3. Trees play a vital role in mitigating the diverse effects of environmental carbon degradation and in reducing global warming. One of these trees African Baobab, is a very long-lived tree with multipurpose uses1-3. The baobabs grow as solitary individuals, however, sometimes they form small groups depending on the nature of underlying soil properties4. Numerous studies in different African countries have highlighted this indigenous fruit tree as a priority species for domestication and expanded use, as the plant is useful in sequestration of carbon, production of medicine, fibres, fruits, and vegetables; as well as the main habitat of bats5,6. Baobab drought adaptation was considered a desirable trait because of its implications for tree survival, as more droughts are predicted in the dry parts of the African Savanna under climate change scenarios. Baobabs are reportedly tolerant of drought conditions by being able to store high amounts of water7. In addition, in some parts of Africa or elsewhere, farmers might be interested in planting baobab trees, which are more tolerant to heavy rains or flooding. This tolerance is assisted by the thick fire-resistant bark, shedding of leaves, and the ability of the tree trunk to absorb water during the rainy season and decrease during the dry season. But nowadays, baobabs are reported to be threatened by climate change, wild animals, and land clearance for agriculture8,9. Drought conditions, which are mainly associated with climate change and deforestation, have negatively influenced the fixation of CO2 in plants10. Elevated levels of CO2 lower photosynthetic activities, biomass accumulation11 and hence carbon storage. Forest biomass stores over 45% of terrestrial carbon stocks, with about 70 and 30% contained within the above and belowground, respectively12. Tropical forests are being cleared at an approximate rate of 15-17 M ha/year13. Allometric models have been developed Toward exactly account for carbon storage in plants, which are both general and species-specific14. Reliable data on the estimation of carbon stock in vegetation are normally obtained when using species-specific models14,15. The biomass assessment has many purposes, such as serving for resource use and environmental management16,12. Thus, the need arises to know how much biomass is available at a specific point in a given time. there is an urgent need to know how much biomass is lost or accumulated over time. The future predictions showed a substantial decrease in the suitable habitats of the baobab over time due to an increase in high-impact areas under the effect of climate change. Works recommends on baobab population as a way of restoring baobabs in arid and semiarid areas14. despite their long extent of over 1000 years, through radiocarbon dating17. This study aimed to determine the biomass and aboveground carbon stock in baobab trees in five sites from Blue Nile, North Kordofan, and West Kordofan States, Sudan.
MATERIALS AND METHODS
Study area: This study was approved in three states, Blue Nile (El Gerri and El-Roseries sites), North Kordofan (Khor Taggat and El Khuwei sites), and West Kordofan (El Nahoud site), Sudan (Table 1). North Kordofan State is located between 10.5°-15°N and Longitudes 27.5°-32°E, occupying a total area of 185,302 km2. The mean annual rainfall ranges from less than 200 mm in the North to about 450 mm in the Southern parts. West Kordofan State is located within Latitudes 27°-29°N, and Longitudes 14°-20°E, comprising an area of 111,373 km2, with mean annual rainfall varies from 300 mm in the North to over 400 mm in the South. In both North Kordofan and West Kordofan States, the climate is hot and semi-arid; its rainfall is concentrated in a single short season, which increases in reliability and length from North (July-September) to South (May-October). The area can be ecologically categorized into two broad zones: (1) Goz sands and gardud non-cracking clays in the North and West, (2) Broad clay plains in the South. Main crops in North Kordofan and West Kordofan States comprise groundnuts, millet, sesame, sorghum, watermelon, and a variety of horticultural crops from small irrigated gardens. Gum Arabic is intensively collected from Acacia senegal (L.) Willd., by both crop and livestock producers11. Blue Nile State lies between Latitudes 10°-13°N and Longitude 33°-36°E, with a total area of 38,500 km2. The climate is the semi-humid zone. The annual rainfall ranges from 650-750 mm. The soils are clayey while others are sandy, the newly developed soils are hill and mountain soils, and reservoir basin soils. Blue Nile State has moderate to rich vegetation, which includes Acacia trees and short grasses, and shrubs. The dominant trees are Acacia spp., such as: Acacia seyal and Acacia Senegal. Other species are Balanites aegyptiaca, Sterculia setigera, Combretum spp., and Boswellia papyrifera. The major crops are groundnuts, sesame, and sorghum.
| Table 1: | Sites with coordinates and average annual rainfall | |||
| States | Sites | Longitude E | Latitude N | Average rainfall (mm) |
| Blue Nile | El Gerri | 11°-49' | 34°-23' | 700 |
| El Roseires | 11°-49' | 34°-36' | 550 | |
| North Kordofan | El Khuwei | 13°-04' | 29°-13' | 350 |
| KhorTaggat | 13°-11' | 30°-18' | 350 | |
| West Kordofan | El Nahoud | 27°-30° | 12°-14° | 350 |
Design of research and data collection: The research was carried out in November, 2021-May, 2022. In each of Blue Nile, North Kordofan, and West Kordofan States, 35, 22 and 16 baobab trees were sampled. No plots were established based on the solitary nature of the plant4. A baobab individual was randomly selected at a minimum distance of 100 m from another to avoid the genetically related individuals sampling18. For each tree sampled, the girth at breast height (1.3 m above ground) was determined twice with a measuring tape19, and height was measured using clinometers. For calculating tree density overall, baobab density was determined as the total number of trees divided by the area of the sample plots. The maximum density within the stand was counted for all baobab trees within a circular area of 1 ha around all cells of a high-resolution grid20. The maximum value of the resulting density grid indicated the highest baobab density per hectare. The crown diameter was measured depending on the crown boundaries marked on the ground at midday.
Data analysis: The allometric models in this study for the forecast of biomass and volume of baobab trees cover wide ranges of tree sizes (DBH 31-318 cm). The developed models can generally be applied to predict the biomass and volume of baobab trees:
Where:
| B | = | Aboveground biomass of baobab trees (kg) | |
| DBH | = | Diameter at breast height (cm) |
The carbon per tree (kg) was estimated as 50% of the biomass15. The total aboveground biomass and carbon (in tons) of baobab trees in each site was divided by the area sampled to give biomass and carbon density.
Statistical analysis: The aboveground biomass and carbon stock in the study area were analyzed using SPSS for Windows v 20.0, Analysis of Variance (ANOVA), where p≥0.05, to compare aboveground biomass in the five study site areas.
RESULTS
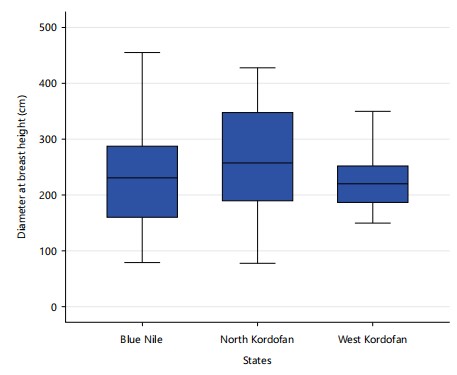
The mean, median, upper quartile, lower quartile, and the comparison between the three states have been tested (Fig. 1). The average diameter of Baobab trees was found to be 229.79, 264.59, 223.63, and 238.45 cm for Blue Nile, North Kordofan, West Kordofan, and the whole experiment (three states), respectively. The overall study area of Blue Nile State had a density of 1.07 trees/ha. The West and North Kordofan States showed a density of 0.72 trees/ha (data not shown). It is worth mentioning that the density of the baobab population in West Kordofan experienced negative impacts resulting from the past drought spells, wind storms, and remarkable changes in climatic conditions.
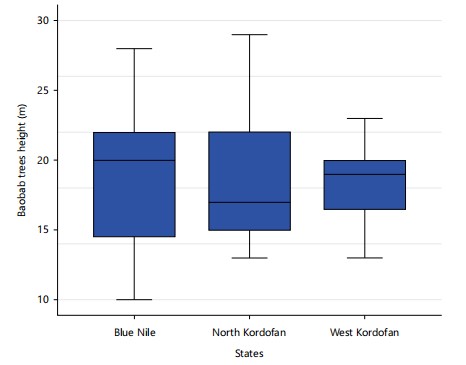
Height by way of one of the biomass/carbon predictor variables. The height was found as 19, 18.18, 18.31, and 18.62 m in Blue Nile, North Kordofan, West Kordofan, and the whole experiment (three states), respectively. Tree height was slightly higher in Blue Nile, followed by West Kordofan, than in North Kordofan Stands (Fig. 2).
|
|
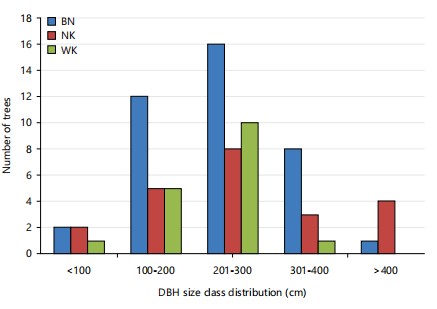
Stem diameters ranged from 79 to 455 cm DBH, with 5 individuals showing DBH values 100 cm (Fig. 3). The most common size class was 201-300 cm, followed by 100-200 cm and 301-400 cm (41%) of trees had DBH values between 201 and 300 cm DBH. The absence of Baobab trees having a DBH lower than 50 cm, which indicates measured a tree is really dangerous.
Table 2 presents data on baobab trees from El Gerri and El Roseries in Blue Nile State. Trees in El Roseries exhibited higher diameters and significantly greater biomass and carbon stock than those in El Gerri. The highest biomass recorded reached 14.6 ton/tree in El Roseries, indicating better growing conditions.
|
| Table 2: | Sites, DBH, biomass, and carbon stock of the baobab tree in the Blue Nile State | |||
| Sites | No. of trees | DBH (cm) | Biomass (kg) | Biomass (ton/tree) | Carbon stock (kg/tree) | Carbon stock (ton/tree) |
| El Gerri | 1 | 154 | 3085.35 | 3.09 | 1542.67 | 1.54 |
| El Gerri | 2 | 160 | 3259.35 | 3.26 | 1629.67 | 1.63 |
| El Gerri | 3 | 190 | 4171.21 | 4.17 | 2085.61 | 2.09 |
| El Gerri | 4 | 170 | 3555.69 | 3.56 | 1777.85 | 1.78 |
| El Gerri | 5 | 127 | 2339.56 | 2.34 | 1169.78 | 1.17 |
| El Gerri | 6 | 164 | 3376.95 | 3.38 | 1688.47 | 1.69 |
| El Gerri | 7 | 99 | 1636.31 | 1.64 | 818.155 | 0.82 |
| El Gerri | 8 | 79 | 1183.54 | 1.18 | 591.768 | 0.59 |
| El Gerri | 9 | 102 | 1707.95 | 1.71 | 853.976 | 0.85 |
| El Gerri | 10 | 127 | 2339.56 | 2.34 | 1169.78 | 1.17 |
| El Gerri | 11 | 125 | 2286.85 | 2.29 | 1143.43 | 1.14 |
| El Gerri | 12 | 154 | 3085.35 | 3.09 | 1542.67 | 1.54 |
| El Gerri | 13 | 110 | 1903.48 | 1.9 | 951.738 | 0.95 |
| El Roseries | 1 | 349 | 9984.33 | 9.98 | 4992.16 | 4.99 |
| El Roseries | 2 | 321 | 8854.9 | 8.85 | 4427.45 | 4.43 |
| El Roseries | 3 | 220 | 5148.19 | 5.15 | 2574.1 | 2.57 |
| El Roseries | 4 | 320 | 8815.33 | 8.82 | 4407.66 | 4.41 |
| El Roseries | 5 | 320 | 8815.33 | 8.82 | 4407.66 | 4.41 |
| El Roseries | 6 | 255 | 6363.42 | 6.36 | 3181.71 | 3.18 |
| El Roseries | 7 | 231 | 5521.67 | 5.52 | 2760.84 | 2.76 |
| El Roseries | 8 | 211 | 4848.59 | 4.85 | 2424.3 | 2.42 |
| El Roseries | 9 | 208 | 4749.94 | 4.75 | 2374.97 | 2.37 |
| El Roseries | 10 | 203 | 4586.91 | 4.59 | 2293.45 | 2.29 |
| El Roseries | 11 | 341 | 9657.45 | 9.66 | 4828.73 | 4.83 |
| El Roseries | 12 | 270 | 6907.54 | 6.91 | 3453.77 | 3.45 |
| El Roseries | 13 | 232 | 5556.01 | 5.56 | 2778.01 | 2.78 |
| El Roseries | 14 | 237 | 5728.7 | 5.73 | 2864.35 | 2.86 |
| El Roseries | 15 | 286 | 7502.61 | 7.5 | 3751.31 | 3.75 |
| El Roseries | `16 | 264 | 6688.27 | 6.69 | 3344.14 | 3.34 |
| El Roseries | 17 | 349 | 9984.33 | 9.98 | 4992.16 | 4.99 |
| El Roseries | 18 | 220 | 5148.19 | 5.15 | 2574.1 | 2.57 |
| El Roseries | 19 | 318 | 8736.35 | 8.74 | 4368.17 | 4.37 |
| El Roseries | 20 | 455 | 14610.3 | 14.6 | 7305.17 | 7.31 |
| El Roseries | 21 | 287 | 7540.29 | 7.54 | 3770.15 | 3.77 |
| El Roseries | 22 | 287 | 7540.29 | 7.54 | 3770.15 | 3.77 |
| Table 3: | Sites, DBH, biomass, and carbon stock of baobab trees in the North Kordofan State | |||
| Sites | No. of trees | DBH (cm) | Biomas (kg) | Biomass (ton/tree) | Carbon stock (kg/tree) | Carbon stock (ton/tree) |
| El Khuwei | 1 | 348 | 9943.29 | 9.94 | 4971.64 | 4.97 |
| El Khuwei | 2 | 287 | 7540.29 | 7.54 | 3770.15 | 3.77 |
| El Khuwei | 3 | 182 | 3921.44 | 3.92 | 1960.72 | 1.96 |
| El Khuwei | 4 | 258 | 6471.16 | 6.47 | 3235.58 | 3.24 |
| El Khuwei | 5 | 350 | 10025.4 | 10 | 5012.71 | 5.01 |
| El Khuwei | 6 | 268 | 6834.21 | 6.83 | 3417.11 | 3.42 |
| El Khuwei | 7 | 255 | 6363.42 | 6.36 | 3181.71 | 3.18 |
| El Khuwei | 8 | 428 | 13382.1 | 13.4 | 6691.05 | 6.69 |
| El Khuwei | 9 | 175 | 3706.76 | 3.71 | 1853.38 | 1.85 |
| El Khuwei | 10 | 243 | 5938.02 | 5.94 | 2969.01 | 2.97 |
| El Khuwei | 11 | 310 | 8422.6 | 8.42 | 4211.3 | 4.21 |
| El Khuwei | 12 | 255 | 6363.42 | 6.36 | 3181.71 | 3.18 |
| El Khuwei | 13 | 417 | 12891.2 | 12.9 | 6445.59 | 6.45 |
| Khor Tagat | 1 | 198 | 4425.61 | 4.43 | 2212.8 | 2.21 |
| Khor Tagat | 2 | 190 | 4171.21 | 4.17 | 2085.61 | 2.09 |
| Khor Tagat | 3 | 283 | 7389.9 | 7.39 | 3694.95 | 3.69 |
| Khor Tagat | 4 | 419 | 12980 | 13 | 6490.01 | 6.49 |
| Khor Tagat | 5 | 81 | 1226.78 | 1.23 | 613.391 | 0.61 |
| Khor Tagat | 6 | 258 | 6471.16 | 6.47 | 3235.58 | 3.24 |
| Khor Tagat | 7 | 124 | 2260.64 | 2.26 | 1130.32 | 1.13 |
| Khor Tagat | 8 | 414 | 12758.3 | 12.8 | 6379.13 | 6.38 |
| Khor Tagat | 9 | 78 | 1162.09 | 1.16 | 581.046 | 0.58 |
| Table 4: | Sites, DBH, biomass, and carbon stock of baobab trees in the West Kordofan State | |||
| Sites | No. of trees | DBH (cm) | Biomass (kg) | Biomass (ton/tree) | Carbon stock (kg/tree) | Carbon stock (ton/tree) |
| El Nahoud | 1 | 277 | 7166.05 | 7.17 | 3583.02 | 3.58 |
| El Nahoud | 2 | 255 | 6363.42 | 6.36 | 3181.71 | 3.18 |
| El Nahoud | 3 | 185 | 4014.55 | 4.01 | 2007.28 | 2.01 |
| El Nahoud | 4 | 211 | 4848.59 | 4.85 | 2424.3 | 2.42 |
| El Nahoud | 5 | 162 | 3317.99 | 3.32 | 1658.99 | 1.66 |
| El Nahoud | 6 | 240 | 5833.07 | 5.83 | 2916.54 | 2.92 |
| El Nahoud | 7 | 230 | 5487.39 | 5.49 | 2743.7 | 2.74 |
| El Nahoud | 8 | 255 | 6363.42 | 6.36 | 3181.71 | 3.18 |
| El Nahoud | 9 | 150 | 2970.97 | 2.97 | 1485.48 | 1.49 |
| El Nahoud | 10 | 190 | 4171.21 | 4.17 | 2085.61 | 2.09 |
| El Nahoud | 11 | 162 | 3317.99 | 3.32 | 1658.99 | 1.66 |
| El Nahoud | 12 | 210 | 4815.64 | 4.82 | 2407.82 | 2.41 |
| El Nahoud | 13 | 201 | 4522.18 | 4.52 | 2261.09 | 2.26 |
| El Nahoud | 14 | 250 | 6185.09 | 6.19 | 3092.54 | 3.09 |
| El Nahoud | 15 | 350 | 10025.4 | 10 | 5012.71 | 5.01 |
| El Nahoud | 16 | 250 | 6185.09 | 6.19 | 3092.54 | 3.09 |
Table 3 summarizes the biomass and carbon values of baobabs in North Kordofan State, particularly from El Khuwei and Khor Taggat. El Khuwei showed the highest biomass per tree (up to 13.4 ton), with DBH reaching over 400 cm, suggesting the presence of mature trees with strong carbon storage potential.
Table 4 details baobab tree data from El Nahoud in West Kordofan. Although DBH and biomass were moderate compared to other regions, a few trees reached 10 ton in biomass. Most trees exhibited values between 3 and 6 ton, reflecting relatively smaller sizes or less favorable site conditions.
Table 5 compares the average DBH, biomass, and carbon stock across all five sites. El Khuwei and El Roseries had the highest mean DBH and biomass values, while El Gerri recorded the lowest. This variation underscores the influence of site-specific environmental factors on tree growth.
Table 6 provides a state-level summary of biomass and carbon stocks. Blue Nile State had the highest aboveground biomass and carbon per hectare, followed by North and West Kordofan. These differences reflect varying tree densities, sizes, and possibly human or climatic impacts across regions.
| Table 5: | Total biomass and carbon stocks under different study sites of Adansonia digitata wild trees | |||
| Sites | N | DBH (cm) | Biomass (kg) | Biomass (ton/tree) | Carbon stock (kg/tree) | Carbon stock (ton/tree) |
| El Gerri | 13 | 135 | 2553.97 | 2.55 | 1276.98 | 1.27 |
| El Roseries | 22 | 277 | 7166.04 | 7.16 | 3583.02 | 3.58 |
| El Khuwei | 13 | 290 | 7653.69 | 7.65 | 3826.84 | 3.82 |
| Khor Taggat | 9 | 227 | 5384.94 | 5.38 | 2692.47 | 2.69 |
| El Nahoud | 16 | 224 | 5283.08 | 5.28 | 2641.54 | 2.64 |
| Average | 238 | 5763.42 | 5.76 | 2881.71 | 2.88 |
| Table 6: | Total biomass and carbon stocks under different study states of Adansonia digitata wild trees | |||
| Variables | Blue Nile | North Kordofan | West Kordofan | Average |
| DBH (cm) | 229.79±86.07 | 264.59±103.99 | 223.62±50.97 | 238.45±86.53 |
| Average biomass (kg/tree) | 5716.66±2972.72 | 7029.50±3728.72 | 5349.25±1773.35 | 6015.41±3052.51 |
| Biomass (ton/tree) | 5.71±2.97 | 7.02±3.72 | 5.34±1.77 | 6.01±3.05 |
| Biomass (ton/ha) | 5.96±2.76 | 5.06±3.04 | 3.67±1.67 | 4.9±2.65 |
| Average carbon stock (kg/tree) | 2858.33±1486.36 | 3514.75±1864.36 | 2674.62±886.67 | 3007.70±1526.25 |
| Carbon stock (ton/tree) | 2.85±1.48 | 3.51±1.86 | 2.67±0.88 | 3.01±1.52 |
| Carbon stock (ton/ha) | 2.98±1.34 | 2.53±1.74 | 1.83±0.78 | 2.45±1.04 |
DISCUSSION
Stem diameters ranged from 79 to 455 cm DBH, the most common size class was 201-300 cm, followed by 100-200 and 301-400 m. Because reliable age estimations are known to be impossible for the baobab4 five successive size classes for the overall samples were created, assuming lower DBH for younger trees and higher DBH for older trees. This size class structure may allow for the evaluation of different recruitment patterns of locations and stands21. In the current study diameter at breast height DBH of 4.55 m, this was also in the range of other observations in Kordofan the (DBH) of up to 4.77 m was also in the range of other observations in Western and Southern Africa21-25. However, Kordofan baobabs can also reach an impressive size of up to 8.93 m DBH as recently verified when 306 baobabs were measured in the Nuba Mountains, Sudan26. The largest recognized baobab up to now was recorded in North-Eastern Namibia with 9.74 m DBH, low staffing rates of size class distribution, which could be due to forest disturbance such as livestock browsing17. Recent expansion of baobab fruit harvesting and the drop in rainfall attributed to climate change have been extensively discussed19,22,23,25.
Similarly, the low aboveground biomass and carbon of baobabs in the study area proposes over harvesting of baobab products by farmers due regular convenience in the area. People harvest the leaves fresh, during the rainy season when the baobab leaves are tender, in many parts of Africa, the bark, which produces strong fibers, is used in making ropes, mats, bags, and hats12. The smooth fibers of the inner side of the bark are more important than the outer bark for weaving26-28. A common practice in agroforestry is associated with a decrease of the forested area with time at the expense of an increase in land used for crop cultivation14. Low biomass recorded due to forest clearance in Brazil29.
The aboveground carbon density of 2.98±1.34 and 2.53±1.74 ton/ha, 1.83±0.78 in Blue Nile, North Kordofan and West Kordofan State, respectively suggested the difference in carbon density between baobabs in the semiarid might be due to allometry which mainly contributes to species specific DBH (few allometric models are available for accounting biomass/carbon in baobab trees, so the select is still narrow), varying degree of contact to human degradation and underlying edaphic factors among others. Furthermore, the carbon density estimates from Afromontane. Rainforests of the Eastern Arc Mountains were found to be between 252 and 581 ton/ha15. Though, on high water content of about 79% in baobab trees and a low wood density ranging between 0.09 and 0.17 g/cm3 as factors for limited carbon density30-32. Finally, since baobab trees have potential for carbon sequestration, they should be considered in the carbon market, and further potential studies should be conducted to provide enough information and knowledge.
CONCLUSION
The study revealed that the aboveground carbon density of baobab trees varied across the study sites, with values of 2.98±1.34, 2.53±1.74, and 1.83±0.78 ton/ha in Blue Nile, North Kordofan, and West Kordofan States, respectively, and an overall average of 2.45±1.04 ton/ha. Lower biomass and carbon stocks were observed in areas impacted by human activities, intensive harvesting, and reduced rainfall. Diameter at breast height (DBH) and tree height were key factors influencing biomass and carbon storage. Variations in carbon values may also be linked to differences in tree age, development stage, and site conditions. Despite these challenges, wild baobab trees demonstrate strong potential for long-term carbon sequestration and should be promoted as part of conservation and climate mitigation strategies. However, the availability of species-specific allometric models remains limited and needs further development.
SIGNIFICANCE STATEMENT
The purpose of this study is to assess the aboveground biomass and carbon storage in the Blue Nile, North and West Kordofan States of Sudan. It also discovers the significance of this tree in its distribution sites. The capacity of carbon storage in the Blue Nile was found to be higher than in the Kordofan States. These trees require a special conservation method to play their role in the ecosystem. However, the improper practices affect the tree population and result in an unbalanced situation. To sum up, this tree should not be neglected due to its effective role in carbon storage and sequestration.
REFERENCES
- Canadell, J.G., C. le Quere, M.R. Raupach, C.B. Field and E.T. Buitenhuis et al., 2007. Contributions to accelerating atmospheric CO2 growth from economic activity, carbon intensity and efficiency of natural sinks. Proc. Natl. Acad. Sci. U.S.A., 104: 18866-18870.
- Dixon, R.K., A.M. Solomon, S. Brown, R.A. Houghton, M.C. Trexier and J. Wisniewski, 1994. Carbon pools and flux of global forest ecosystems. Science, 263: 185-190.
- Luyssaert, S., I. Inglima, M. Jung, A.D. Richardson and M. Reichstein et al., 2007. CO2 balance of boreal, temperate and tropical forests derived from a global database. Global Change Biol., 13: 2509-2537.
- Johansson, M., 1999. The baobab tree in Kondoa Irangi Hills, Tanzania. Swedish University of Agricultural Sciences, Sweden, Pages: 56.
- Kamatou, G.P.P., I. Vermaak and A.M. Viljoen, 2011. An updated review of Adansonia digitata: A commercially important African tree. South Afr. J. Bot., 77: 908-919.
- Lisao, K., C.J. Geldenhuys and P.W. Chirwa, 2017. Traditional uses and local perspectives on baobab (Adansonia digitata) population structure by selected ethnic groups in Northern Namibia. S. Afr. J. Bot., 113: 449-456.
- van den Bilcke, N., S. de Smedt, D.J. Simbo and R. Samson, 2013. Sap flow and water use in African baobab (Adansonia digitata L.) seedlings in response to drought stress. South Afr. J. Bot., 88: 438-446.
- Dai, A., 2013. Increasing drought under global warming in observations and models. Nat. Clim. Change, 3: 52-58.
- Birhane, E., K.T. Asgedom, T. Tadesse, H. Hishe, H. Abrha and F. Noulèkoun, 2020. Vulnerability of baobab (Adansonia digitata L.) to human disturbances and climate change in Western Tigray, Ethiopia: Conservation concerns and priorities. Global Ecol. Conserv., 22.
- Wu, Y., H. Zhong, J. Li, J. Xing, N. Xu and H. Zou, 2022. Water use efficiency and photosynthesis of Calamagrostis angustifolia leaves under drought stress through CO2 concentration increase. J. Plant Interact., 17: 60-74.
- Zheng, Y., F. Li, L. Hao, A.A. Shedayi and L. Guo et al., 2018. The optimal CO2 concentrations for the growth of three perennial grass species. BMC Plant Biol., 18.
- Mokany, K., R. Raison and A.S. Prokushkin, 2006. Critical analysis of root: Shoot ratios in terrestrial biomes. Global Change Biol., 12: 84-96.
- Kumar, B.M., S.J. George, V. Jamaludheen and T.K. Suresh, 1998. Comparison of biomass production, tree allometry and nutrient use efficiency of multipurpose trees grown in woodlot and silvopastoral experiments in Kerala, India. For. Ecol. Manage., 112: 145-163.
- Malley, Z.J.U., W.N. Mmari and M.K. Mzimbiri, 2016. Combining tree-crop farming: Mimicking farmers' mixed cropping and land fallowing practices in developing sustainable farmland management system. J. Agric. Sustainability, 9: 104-126.
- Msalilwa, U.L., L.K. Munishi, E.E. Makule and P.A. Ndakidemi, 2020. Pinpointing baobab (Adansonia digitata [Linn. 1759]) population hotspots in the semi-arid areas of Tanzania. Afr. J. Ecol., 58: 455-467.
- Munishi, P.K.T. and T.H. Shear, 2004. Carbon storage in afromontane rain forests of the Eastern Arc Mountains of Tanzania: Their net contribution to atmospheric carbon. J. Trop. For. Sci., 16: 78-98.
- Parresol, B.R., 1999. Assessing tree and stand biomass: A review with examples and critical comparisons. For. Sci., 45: 573-593.
- Patrut, A., K.F. von Reden, D.A. Lowy, A.H. Alberts and J.W. Pohlman et al., 2007. Radiocarbon dating of a very large African baobab. Tree Physiol., 27: 1569-1574.
- Assogbadjo, A.E., T. Kyndt, B. Sinsin, G. Gheysen and P. van Damme, 2006. Patterns of genetic and morphometric diversity in baobab (Adansonia digitata) populations across different climatic zones of Benin (West Africa). Ann. Bot., 97: 819-830.
- Wickens, G.E., 2008. The Baobabs: Pachycauls of Africa, Madagascar and Australia. Springer, Dordrecht, The Netherlands, ISBN-13: 9781402064302, Pages: 498.
- Gebauer, J. and E. Luedeling, 2013. A note on baobab (Adansonia digitata L.) in Kordofan, Sudan. Genet. Resour. Crop E, 60: 1587-1596.
- Assogbadjo, A.E., B. Sinsin and P. van Damme, 2005. Morphological characters and production of baobab tree capsules (Adansonia digitata L.) in Benin. Fruits, 60: 327-340.
- Sanchez, A.C., S. de Smedt, N. Haq and R. Samson, 2011. Comparative study on baobab fruit morphological variation between Western and South-Eastern Africa: Opportunities for domestication. Genet. Resour. Crop E, 58: 1143-1156.
- Duvall, C.S., 2007. Human settlement and baobab distribution in South-Western Mali. J. Biogeogr., 34: 1947-1961.
- Venter, S.M. and E.T.F. Witkowski, 2010. Baobab (Adansonia digitata L.) density, size-class distribution and population trends between four land-use types in Northern Venda, South Africa. For. Ecol. Manage., 259: 294-300.
- Wiehle, M., S. Goenster, J. Gebauer, S.A. Mohamed, A. Buerkert and K. Kehlenbeck, 2014. Effects of transformation processes on plant species richness and diversity in homegardens of the Nuba Mountains, Sudan. Agrofor. Syst., 88: 539-562.
- Gebauer, J., K. El-Siddig and G. Ebert, 2002. Baobab (Adansonia digitata L.): A review on a multipurpose tree with promising future in the Sudan. Gartenbauwissenschaft, 67: 155-160.
- Igboeli, L.C., E.O.H. Addy and L.I. Salami, 1997. Effects of some processing techniques on the antinutrient contents of baobab seeds (Adansonia digitata). Bioresour. Technol., 59: 29-31.
- Fearnside, P.M., 2005. Deforestation in Brazilian Amazonia: History, rates and consequences. Cons. Biol., 19: 680-688.
- Chapotin, S.M., J.H. Razanameharizaka and N.M. Holbrook, 2006. A biomechanical perspective on the role of large stem volume and high water content in baobab trees (Adansonia spp.; Bombacaceae). Am. J. Bot., 93: 1251-1264.
- Kimaro, A.A., V.R. Timmer, S.A.O. Chamshama, Y.N. Ngaga and D.A. Kimaro, 2009. Competition between maize and pigeonpea in semi-arid Tanzania: Effect on yields and nutrition of crops. Agric. Ecosyst. Environ., 134: 115-125.
- Naveenkumar, J., K.S. Arunkumar and S.M. Sundarapandian, 2017. Biomass and carbon stocks of a tropical dry forest of the Javadi Hills, Eastern Ghats, India. Carbon Manag., 8: 351-361.
How to Cite this paper?
APA-7 Style
Gurashi,
N.A., Eltahir,
M.E. (2025). Assessment of Adansonia digitata L. Aboveground Biomass and Carbon Storage in Blue Nile, North and West Kordofan State, Sudan. Trends in Agricultural Sciences, 4(4), 269-277. https://doi.org/10.17311/tas.2025.269.277
ACS Style
Gurashi,
N.A.; Eltahir,
M.E. Assessment of Adansonia digitata L. Aboveground Biomass and Carbon Storage in Blue Nile, North and West Kordofan State, Sudan. Trends Agric. Sci 2025, 4, 269-277. https://doi.org/10.17311/tas.2025.269.277
AMA Style
Gurashi
NA, Eltahir
ME. Assessment of Adansonia digitata L. Aboveground Biomass and Carbon Storage in Blue Nile, North and West Kordofan State, Sudan. Trends in Agricultural Sciences. 2025; 4(4): 269-277. https://doi.org/10.17311/tas.2025.269.277
Chicago/Turabian Style
Gurashi, Nasreldin, Abdelrahaman, and Muneer Elyas Siddig Eltahir.
2025. "Assessment of Adansonia digitata L. Aboveground Biomass and Carbon Storage in Blue Nile, North and West Kordofan State, Sudan" Trends in Agricultural Sciences 4, no. 4: 269-277. https://doi.org/10.17311/tas.2025.269.277

This work is licensed under a Creative Commons Attribution 4.0 International License.