Technical Efficiency Differences between Cluster Farming Participants and Non-Participants among Maize Producers in Silti District, Ethiopia
-
Haider Abdo

Agricultural Economics and Gender Researcher at Worabe Agricultural Research Center, Central Ethiopia Agricultural Research Institute, Ethiopia
Miilion SileshiSchool of Agricultural Economics and Agribusiness, Haramaya University, Ethiopia
Sime ShiferawSchool of Agricultural Economics and Agribusiness, Haramaya University, Ethiopia
| Received 19 Apr, 2025 |
Accepted 28 Jun, 2025 |
Published 30 Sep, 2025 |
Background and Objective: Despite Ethiopia’s agricultural potential, various studies have shown that many crops, including maize, are produced below their expected frontier levels. This study investigates the technical efficiency of maize producers in the Silti District, with a particular focus on comparing cluster farming participants and non-participants. The primary objective is to assess whether participation in maize cluster farming significantly improves production efficiency. Materials and Methods: The study employed a stochastic frontier analysis to estimate the technical efficiency of maize producers. Data were collected from a representative sample of maize-growing households in the Silti District. Key inputs such as labor, fertilizer and land size were included in the production function. Statistical analysis was performed to identify significant determinants of efficiency and compare efficiency levels between participant and non-participant groups with a 0.05 significance level. Results: The findings indicate an increasing return to scale in maize production. The average technical efficiency across all sampled households was 74.2%, suggesting a 25.8% potential output gain if existing resources are fully optimized. Notably, cluster farming participants exhibited a significantly higher mean technical efficiency (82%) compared to non-participants (66%), demonstrating the positive impact of the cluster farming approach. Conclusion: The study underscores the effectiveness of maize cluster farming in enhancing technical efficiency. It recommends strengthening cluster-based strategies alongside improved access to inputs, training and extension services to promote sustainable agricultural productivity. Future research may explore long-term impacts and scalability across other regions and crops.
| Copyright © 2025 Abdo et al. This is an open-access article distributed under the Creative Commons Attribution License, which permits unrestricted use, distribution, and reproduction in any medium, provided the original work is properly cited. |
INTRODUCTION
As globally maize ranked the second most produced grain in terms production volume following rice and also second most widely grown crop in terms of area coverage following wheat and in terms of production, the world top three maize producing countries are USA, China and Brazil, which produce 347,048,000, 260,958,000 and 101,139,000 tons, respectively of the 1.1 billion tons of maize produced in the world1. To enhance agricultural productivity and transform subsistence farming to market-oriented, smallholder farmers must get better technology and practices, such as cluster farming, to improve the technical efficiency2. The main cereal crops grown in Ethiopia are teff, wheat, maize and sorghum3. Out of the total area covered by grain crop cereals, such as teff, maize, sorghum, barley and wheat, they account for 24, 16.98, 14.97, 6.97 and 13.49%, respectively. However, the production and productivity of cereal are still unsatisfactory and below the standard levels4. In the past two decades, Ethiopian agricultural policies and investments have focused on developing and intensifying cereal crops, which are an important driver of income for a significant population5. Moreover, in 2021, cereal production level in Ethiopia reached 29,080,826.3 tons; again, these crops represent about 95% of agricultural production in terms of area coverage6.
According to the World Data Atlas report in Ethiopia 2021, maize gives the highest yield per unit area at 4 tons per ha, followed by rice, wheat, sorghum, barley and teff, but the production level is still lower than the rest of the world (5.78 t/ha). In Ethiopia, maize is one of the main crops, ranking first in production and productivity and second in area coverage. This makes the highest proportion of annual grain production of the country, accounting for 27.02%, followed by teff, 17.29% of the total production. Agriculture is the backbone of the study zone economy and in 2021, the cereal production level in the Siltie Zone was about 347,572.954 tons6. Maize production plays a vital role in the livelihoods of smallholder farmers in the Siltie Zone. In terms of both area coverage and production volume, maize became a significant staple crop during the 2020/21 production season. According to a study7, there is still a significant gap between the actual and potential yield in smallholder maize farmers in Ethiopia due to biotic and abiotic stresses, such as diseases, insect pests, drought, flood and land fragmentation account for a large part of the yield difference. According to this study, the actual average maize production in Ethiopia was 3.24 t/ha with a technical efficiency of 0.86 in which that farmers have the potential to increase the production level by 14.4% if they use it efficiently7. In addition, maize production fluctuated in the country and specifically in the Siltie Zone over time. To solve such kinds of challenges, cluster farming is the best solution.
The concept of agricultural cluster was introduced as a means of integrating intervention in the transformation agenda in specific geographical areas targeting a limited number of high-value commodities, such as wheat, barley, teff and maize8. In order to ensure commercialization, specialization, sustained supply of raw materials and to generate income, the link could increase the participation of smallholder farmers’ priority agricultural commodity cluster farming with an ultimate emphasis on processing and value addition9. In addition, up to 2019, 31 agricultural crop clusters have been designed in different regions of Ethiopia, such as Amhara, Oromia, SNNPR and Tigray, with 3.7 million farmers in 300 selected districts, allowing for enhanced benefits in terms of production, marketing and value addition10. The concept of cluster farming is explained as the concentration of agricultural activity that generates income and employment opportunities in and around a specific area11. In cluster farming, groups of smallholders usually pool their resources together for agricultural production, coordinate and market their product jointly and consequently reduce transaction costs, lower information asymmetries and improve bargaining power12,13. It can serve as an efficient mechanism for extension services and private business companies to reach and interact with multiple farmers and share agricultural-related information14. It is also a coordination effort of government and development actors in reaching out to farmers, especially for targeted input provision like fertilizers, improved seed and mechanization and so on. Moreover, support services such as extension, training and capacity building10. In cluster farming groups, the farmers are expected to adopt the current full package of the farm recommendation, including the use of inputs like improved seed, fertilizers and other improved agricultural practices, which in turn improves their technical efficiency15.
In Ethiopia, the studies conducted on the technical efficiency of many potential crops revealed that there are significant agricultural production problems in which, producing crops less than the frontier level of production. For instance, in the case of production, it has produced 4416, 29.9717 and 18%18 less than efficiency levels. Therefore, cluster farming is the best option to support smallholder farmers to overcome these challenges and produce at an efficient level. However, no more attention was given to the study of maize production in cluster farming. In addition to that, the existing studies that are concerned with the technical efficiency of maize did not well interconnect with the clustering farming practice. Such studies did not show how much technical efficiency was generated by the implementation of such improved farming practice (cluster farming practice) of the smallholder producers, specifically in maize production. There is also a scarcity of empirical studies in the Siltie Zone regarding the effect of cluster farming participation on household technical efficiency. Lack of such kind of empirical investigations has created an information gap on the performance of such better practices in the study area. Therefore, due to this case, it is uncertain to know the extent at which the households participating in maize cluster farming are more efficient than their counterparts. Moreover, no effort has been made by the researchers, similar to the current study to identify the technical efficiency level of maize farmers for both groups. Understanding the level of technical efficiency difference between cluster participants and non-participants is crucial for policymakers and stakeholders to improve empirical evidence. This study aims to generate actionable insights that can support the effective implementation of cluster farming initiatives, addressing the need for reliable and relevant information to increase the technical efficiency level in the study area. Therefore, this study aimed to determine the technical efficiency level of maize on the sample households between cluster participants and non-participants in the study area.
MATERIALS AND METHODS
Study area: This study was conducted in the Silti District, Siltie Zone, which is found in the Central Ethiopia region, Ethiopia. Which is around 172 km from Addis Ababa which is the capital city of Ethiopia. The study was conducted in 2023-2024. Siltie Zone can be classified into three major climatic zones based on altitude, rainfall and temperature: 20.6% Dega, 74.4% Woina-Dega and 5% Kolla from the total area of the region which shows the study area have varied ecological zones that range from lowland to highland, which makes possible the cultivation of various crop. Silti District is borders on the east from Oromia region, on the west from Alicho Wurero, on the north from Gurage zone and Lanfuro and Dalocha on the south. Approximately 207,151 people (101,460 men and 105,691 women) live in this district, of whom 19,211 are urban and 187,940 are rural. About 53,112 hectares of land make up the entire district of which 25,635 hectares are annual agricultural land, 11,221 hectares are perennial, 6,365 hectares are grazing pasture, forests and 6,904 hectares are bush land (SZBoA, 2019). Among the ten districts, one of the major ones where maize cluster farming is Silti District. The farm households in the study area participating in the cluster farming were required to contribute at least 0.2 ha of land to participate in cluster farming. In that cluster, farmers implement the most effective farm agronomic recommendations and undertake to grow cluster priority crops. The area of this district has been bound by the community is around 13,500 hectares of land. In addition, in the Silti District, 4494 ha of land are covered by maize seeds, from which 3958 ha are cultivated in clusters and a total of 91 clusters appear (SZBoA, 2024). In this district widely adopted cluster farming initiative optimizes the use of the full package of agricultural inputs.
Data type, sources and collection methods: Both primary and secondary data were used for the study. The primary data collected from smallholder maize producers was collected through interviews. The questionnaires were pre-tested on sample households from participants and non-participants in maize cluster farming before conducting the actual field survey to check their relevance. Secondary data was collected from the cooperative union, the agricultural office, books and journal papers.
Sampling technique and sample size: A Multistage sample procedure was used to select the sample households. In the first stage, Silti District was purposefully selected from the Siltie Zone based on maize production level and the potential to undertake maize cluster farming from the existing districts. There are 24 kebeles in the district and among those kebeles, 10 of them were practicing maize cluster farming. In the second stage, from the existing kebeles that undertake cluster farming, four kebeles were selected using simple random sampling. Finally, the households were stratified into two strata, which were maize cluster participants and non-participants and total respondents were selected using simple random sampling according to the proportional size of the two groups. Yamane’s19 formula was used to determine the total sample size of smallholder farmers in the study area:
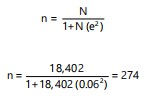 |
Hence, according to Yamane’s formula, the intended sample size was 274 farmers. However, for this study, 304 farmers were surveyed to decrease potential inaccuracies. Where n is the sample size, N is the population size of maize producers in the district (the total maize producers in the district was 18,402), e = level of precision, which is 6%, was used due to no more variations among the population.
Method of data analysis
Descriptive statistics: The descriptive statistics analysis, such as maximum, minimum, mean, standard deviation, percentages and frequency, was used to analyze the demographic and socio-economic characteristics of the maize producers’ households. In addition, test statistics such as the t-test were applied for continuous variables, Chi-square (χ2) test was used for dummy variables to check the significance differences and associations of variables between cluster participants and non-participants of maize producers, respectively.
Econometric methods
Stochastic production frontier approach (SPFA): The stochastic frontier production model was used to estimate the technical efficiency level. It is used due case that it has the potential to capture the random effects like weather, measurement error, which leads to inefficiency among smallholder farmers. Stochastic frontier analysis was based on a specific functional form, which was independently proposed to indicate those firms/farmers usually do not achieve their full potential output due to the existence of inefficiencies20,21. The stochastic production frontier was developed by adding a symmetric error term () to the non-negative error term and in general is given by:
Where Yi is output of maize, f (Xi; ß) and exp (Vi-Ui) and represents both the deterministic and stochastic part of the production frontier function. It is a random error having zero mean, which is associated with a random factor. The above equation is written as:
ln (γi)=β0+β1 ln (area)+ β2 ln (seed)+β3 ln (fertilizer)+β4 ln (chemical)+β5 ln (labor)+β6 ln (oxen)+εi(vi -ui)
Where, in natural logarithms, yi represents the maize output of the sample farmer, area represents the land allocated for maize production per hectare, labor is the number of both hired and family labor used by the farmer in man-days. Oxen is the number of oxen power used for operation by the farm household in oxen-day, fertilizers are the quantity of NPS and urea fertilizers applied by a farmer in maize and measured in kilograms. In addition, maize seed represents the quantity of maize seed used in kilograms; β is the production coefficient or an unknown parameter to estimate. εi is an error term made up of two components; vi is a random error having zero mean, N (0, δ2v), which is associated with random factors. Errors such as measurement error in production and weather effect, which are out of the control of the farmers and assumed to be independently and identically distributed as N (0, δ2v) with a random error. ui is the non-negative efficiency measured relative to the stochastic frontier that is firm not attaining maximum efficiency of production and ranges between 0 and 1, which is also assumed to be independently and identically distributed as half-normal at zero mean or truncated half-normal at mean μ, N [μ, δ2u]. Given the assumptions of the stochastic frontier model (1), inference about the parameters of the model can be based on the maximum-likelihood estimators due to the standard regularity conditions holding. the maximum-likelihood estimates of the parameters of the model obtained in terms of parameterization, σ2= σv2+σu2 and (λ) = σu∕σv and the technical efficiency function is given as20,22:
Where, Yi is the atual yield obtained y farm household, Yi* is the maximum potential yield from cluster maize, ui represents the technical inefficiency of farmer, βi is a vector of unknown parameters to be measured and are unobserved random terms that vi are independently distributed with zero mean and variance of δ2.
RESULTS AND DISCUSSION
Descriptive analysis
Descriptive statistics of continuous variables: This part tries to discuss socio-economic, demographic, institutional and other farm characteristics among participants and non-participants. Table 1 below presents the continuous explanatory variables used in the participation decision and their impact on maize cluster farming. Based on the results, there was a statistically significant difference between participants and non-participants in terms of age, education level, family size, livestock owned, total land and frequency of extension contacts. The mean age of the sample household heads was 42.13 years and the mean age of cluster farming participants' and non-participant households was 48.22 and 35.98 years, respectively. The results show that the average education level in years of schooling of the household head was approximately 2 years. Furthermore, it was observed that the average educational level of cluster participants was higher than that o f non-participants, with a mean schooling of approximately 3 and 2 years, respectively. The t-value results indicate that there was a significant difference between participants and non-participants of maize cluster farming concerning the age and education of household heads at 1 and 5% significance level, respectively. The average land size of cluster farming participants was 1.04 ha of land, while 0.76 ha of their counterparts. This indicates that cluster farming participants own greater cultivated land than non-participants. The t-value result of farm size shows that there was of statistically significant mean difference between the two groups at 1% level. The result also indicated that the maize producers’ households in the study area had on average, approximately 5 TLU. Comparing the two groups, maize cluster participants had a greater average livestock (6 TLU) than non-cluster participants (4 TLU). The t-value results for farm size and livestock ownership indicate that there was a significant mean difference between participants and non-participants at 1% level.
The results in Table 1 indicated that the average family size (man-equivalent) of the total sampled households was approximately 4. This can be considered as a proxy for the labor resource for maize production and the result shows that the mean family size of cluster participants and non-participants was approximately equal to 5 and 4, respectively. This is important due to the family size is the main source of labor for developing countries like Ethiopia. The other important variable was the frequency of extension contacts with the sampled farm households. According to the study results, cluster participant households get a higher average frequency of contacts (13.96) as compared to the non-participant (2.1). This result indicated that cluster participant households had a better opportunity to get services of extension contacts related to new agricultural technologies and practices. The t-test result shows that there was a significant difference in terms of family size and frequency of extension contacts between cluster participants and non-participants at 1% significance level.
| Table 1: | Descriptive statistics of continuous variables | |||
| Non-participant (N = 151) | Participant (N = 153) | Total sample (N = 304) | |||||
| Variables | Mean | SD | Mean | SD | Mean | SD | t-value |
| Age | 35.98 | 7.752 | 48.22 | 9.37 | 42.13 | 10.55 | -12.4*** |
| Education level | 1.629 | 2.87 | 2.86 | 2.88 | 2.25 | 2.9 | -3.74** |
| Family size(man equivalent) | 3.5 | 1.3 | 4.6 | 1.7 | 4.07 | 1.6 | -6.25*** |
| TLU | 3.699 | 2.377 | 5.43 | 2.77 | 4.57 | 2.72 | -5.82*** |
| Total land | 0.759 | 0.283 | 1.04 | 0.48 | 0.7 | 0.48 | -6.16*** |
| Frequency of extension contact | 2.1 | 4.54 | 13.96 | 15.23 | 8.07 | 12.72 | -9.18*** |
| Distance market | 7.65 | 2.53 | 6.27 | 3.06 | 7.01 | 2.9 | 4.65 |
| **,***Significant probability levels at 1 and 5%, respectively. Source: From own computation (2024) | |||||||
| Table 2: | Descriptive statistics of discrete variables | |||
| Non-participant (151) | Participant (153) | Total (304) | ||||||
| Variables | Description | Freq. | % | Freq. | % | Freq. | % | χ2 value |
| Sex | Female | 25 | 16.56 | 19 | 12.42 | 44 | 14.5 | 1.05 |
| Male | 126 | 83.44 | 134 | 87.58 | 260 | 85.5 | ||
| Off/non-farm income | Yes | 64 | 42.38 | 66 | 43.14 | 130 | 42.76 | 0.0176 |
| No | 87 | 57.62 | 87 | 56.86 | 174 | 57.24 | ||
| Access of credit | Yes | 21 | 13.9 | 44 | 28.76 | 65 | 21.4 | 9.97** |
| No | 130 | 86.1 | 109 | 71.24 | 239 | 78.6 | ||
| Training access | No | 99 | 65.56 | 16 | 10.45 | 115 | 37.83 | 98.12*** |
| Yes | 52 | 34.44 | 137 | 89.55 | 189 | 62.17 | ||
| Cooperative membership | No | 124 | 82.12 | 88 | 57.5 | 212 | 69.7 | 21.8*** |
| Yes | 27 | 17.88 | 65 | 42.5 | 92 | 30.3 | ||
| **,***Significant probability levels at 1 and 5%, respectively. Source: Own computation survey (2024) | ||||||||
Descriptive statistics of categorical variables: The descriptive summary of categorical variables used in this study is presented below in Table 2. From those categorical variables, access to training, access to credit, access to information and cooperative membership showed a existence of significant association with maize cluster participants’ status, while sex and off/non-farm participation did not show the existence of significant association with maize cluster participants’ status. About the sex of the household heads, about 85.5% of the total household heads were male and the remaining 14.5% of the respondents were female-headed. In addition, for participants and non-participants, the proportion of male-headed households were 87.58 and 83.44%, respectively. Another key factor was the accessibility of training; among the respondents, 62.17% had access to training concerning maize production and the importance of cluster farming, while 37.83% of the respondents did not receive any training. From cluster farming participants, 89.55% had access to training, which was higher as compared to 34.44% of the non-cluster participants. More advanced training helps to enhance access to information about the importance of technological practices, which help farmers to increase their productive capacity. Furthermore, the Chi-square results indicated that there was a significant association between the training access of the households and their maize cluster participants’ status at 1% significance level.
The other variable was participation in off/non-farm activity, which was one of the economic characteristics of the sample households and important for income source for farmers of the study area. The statistical result indicated that from the total sampled households, 42.76% of them were engaged in off/non-farm activities. Moreover, 43.14% of cluster participants and 42.38% of non-cluster participants engaged in off/non-farm activities. Agricultural credit is an important resource that could be used to boost agricultural production and productivity, as it is expected to enhance farmers’ ability to purchase essential agricultural inputs. According to the study results in Table 2, shows that only 21.4% of the sample respondents had credit access. Further, 28.76% of cluster participants and 13.9% of the non-participants had access to credit. The Chi-square test result shows that there was a significant association between credit access and maize cluster participants’ status at the 5% level.
| Table 3: | Descriptive statistics of variables to identify technical efficiency | |||
| Non-participants | Participant | Total | |||||
| Variables | Mean | SD | Mean | SD | Mean | SD | t-value |
| Maize output (qt/ha) | 29.2 | 6.09 | 53.15 | 19.4 | 42.2 | 16.3 | |
| Land size (ha) | 0.46 | 0.2 | 0.54 | 0.32 | 0.5 | 0.27 | -2.6** |
| Maize seed (kg) | 10.3 | 4.97 | 13.2 | 7.89 | 11.74 | 6.8 | -3.92*** |
| NPS (kg) | 43.57 | 20.1 | 54.5 | 32.2 | 49.05 | 27.4 | -3.5** |
| Urea (kg) | 43.98 | 22.3 | 71.6 | 45.1 | 57.87 | 38.2 | -6.75*** |
| Oxen (oxen-day) | 4.02 | 2.3 | 4.6 | 2.4 | 4.3 | 2.4 | -2.3** |
| Labor (man-days) | 23.98 | 8.4 | 29.2 | 12.8 | 26.6 | 11.2 | -4.24** |
| Chemical (liter) | 0.44 | 2.7 | 0.54 | 0.59 | 0.49 | 1.9 | -0.45 |
| **,***Significant probability levels at 1% and 5% respectively. Source: Own computation survey (2024) | |||||||
The other institutional variable of interest with cluster farming participation decisions was membership in various agricultural associations/cooperatives, as this helps farmers in accessing essential agricultural inputs timely manner and at a fair price. The Chi-square test result shows that there was of significant association between cooperative membership and maize cluster participants’ status at the 1% level. As shown in Table 2, from the total sampled households, 30.3% were members of the agricultural cooperatives in the study area. The result also indicated that from sampled cluster participant households, 42.2% were members of agricultural cooperatives, which was higher compared to 17.88% for non-participants.
Descriptive statistics to identify technical efficiency of maize production: The technical efficiency of smallholder maize farmers is determined by many factors. In order to realize the aspects, it is essential to know the descriptive statistics of the input utilization and the maize yield obtained in the study period. The quantity of maize seed for sawing, oxen-power, labor force, chemical and fertilizers (NPS and urea) were the factors used to identify technical efficiency and quantity of maize production as an output. The result in Table 3 shows that on average, the households produced 42.2 qt/ha with a standard deviation of 16. 3 and the amount o f maize produced by the participants and non-participants was 53.15 and 29.2 qt/ha, respectively. This shows the cluster participants produce more maize output than their counterparts. The average amount of maize seed used for sowing by the households was 11.74 kg with a standard deviation of 6.8. Cluster participant households used a higher mean quantity of seed (13.2 kg) than non-participants (10.3 kg). The average land size allocated for maize production by the sample households was 0.5 ha and the mean value of land distribution for maize production by cluster participants (0.54 ha) was slightly higher than non-participants (0.46 ha). In the study area, all of the respondents used improved maize varieties. The other variables used as input were fertilizers, which include NPS and urea. The mean amount of NPS fertilizers used by the total sample households was 49.05 kg. The average amount of NPS fertilizer utilized by participants and non-participants was 54.5 and 43.57 kg, respectively. On the other hand, the mean amount of urea used by the total sample of households was 57.87 kg. And the mean amount of urea used during the production season by cluster participants and non-participants was 71.6 and 43.98 kg, respectively.
Maize producers in the study area used daily labor for different farming activities, including for tillage, chemical application, sawing, weeding, harvesting, threshing and other farm activities. The source of labor in the study area is either hired or family labor. The result shows that the average amount of labor in maize producer households was 26.6 man-days with a standard deviation of 11.2. Further, the average labor utilized by cluster participants and non-participants was found to be 29.2 and 23. 98 man-days, respectively. The other input variable used by maize producers is oxen power. The result indicates that the average oxen-power utilized by the households was 4.3 oxen-days and the average number of oxen used by the participants and non-participants was 4.6 and 4 oxen-days per production season, respectively. Another essential variable used by the farmers was chemicals. The survey result shows that the average chemicals utilized by the households for maize production was 0.49 liters. In addition, the average level of chemicals used by cluster participants and non-participant households was 0.54 and 0.44 liters, respectively. Finally, the t-test value indicates that, except chemicals, all the remaining factors of production show significant mean difference among the groups at 1% and 5% significance levels.
| Table 4: | Likelihood ratio test result of the data | |||
| Null hypothesis | LR | Critical χ2-value | DF | Decision |
| Ho: β7 = --,β27 = 0 | 87.428 | 88.43 | 21 | Accepted |
| DF= degree of freedom, LR=likelihood ratio, at 1% significance level. | ||||
| Table 5: | Estimates of the Cobb-Douglas frontier production function | |||
| Variables | Coef. | Std. Err. | z | P>z |
| Ln seed | 0.105 | 0.09 | 1.16 | 0.248 |
| Ln oxen | 0.126** | 0.05 | 2.42 | 0.015 |
| Ln labor | 0.843*** | 0.103 | 8.2 | 0.000 |
| Ln chemical | 0.015*** | 0.003 | 4.6 | 0.000 |
| Ln land | -0.22 | 0.12 | -1.92 | 0.055 |
| Ln fert | 0.42*** | 0.07 | 6 | 0.000 |
| _cons | -2.053*** | 0.52 | -4.01 | 0.000 |
| sigma_u | 0.24 | 0.03 | 8.42 | 0.000 |
| sigma_v | 0.17 | 0.02 | 8.93 | 0.000 |
| Variance of parameters | ||||
| (σ2) = σ2u+σ2v | 0.0865 | |||
| Lambda (λ) = σu∕σv | 1.38 | 0.044 | 31.69 | 0.000 |
| Gamma (γ) = (1- 1/1+λ2) or (σ2u/σ 2) | 0.66*** | |||
| Return to scale | 1.29 | |||
| Log likelihood | -37.2588 | |||
| Wald chi2(6) | 1484.73*** | |||
| **,*** indicate significance levels at 1% and 5% respectively | ||||
Econometric model results
Estimation of technical efficiency level: Before the estimation of the SFP for the analysis of the technical efficiency of maize producers, different tests were conducted. The decision to choose an appropriate functional form for the data, either Cobb-Douglas or Translog production function, depends on the calculated value of the likelihood ratio. The number of restrictions is taken to be equal to the degree of freedom. If the calculated LR value is less than the critical Chi-square value, then the Cobb-Douglas functional form is used to estimate the technical efficiency23. In Table 4, the test results of the null hypothesis (H0) stating that all elasticities of the interaction terms in the Translog function are equal to zero, against the alternative hypothesis (H1) that they are different from zero, are presented. The tests were done based on a generalized likelihood ratio test, LR = or so, LR = -2(-37.2588 – 6.4553) = 87.428. The calculated log likelihood ratio (LR) was found to be 87.428 and the critical Chi-square (χ²) distribution with the degree of freedom at 21 and a 1% significance level is 88.43. This shows that it is possible to use the Cobb-Douglas production function due to the calculated likelihood ratio is less than the critical value. Therefore, in this study Cobb-Douglas functional form was used to estimate the technical efficiency of the sample households shown in Table 4.
As it was explained at the methodology section, the SPF model was used to analyze the technical efficiency level of maize producers in the study area. Land size, seed, labor, fertilizers (NPS and urea), chemicals and oxen power were used in the model. The results in Table 5, show that the (Wald chi2 (6) = 1484.73) was significant for a group of maize producers at a 1% significance level, indicating that the model as a whole was significant in the study area. Specifically, labor, fertilizer, chemical, maize land size and oxen power were the significant variables that determined the technical efficiency level of maize producers in the study area. The coefficients of explanatory variables are equivalent to the sensitivity of the output concerning each input. For instance, the coefficient of oxen power indicated that a 1% increase in the use of oxen power increases the maize output by 0.126%, keeping the quantities of other inputs constant. This result is similar with the previous findings24,25. Similarly, a 1% increase in the number of labor force increases the amount of maize output by 0.843% ceteris paribus. The quantity of chemical utilized affects the amount of maize production positively at a 1% significance level, in which a 1% increase in the amount of chemical used increases the maize output by 0.015% when other things are held constant. In addition, fertilizers affect the maize production level positively at a 1% significance level. This result is consistent with the previous findings of26,27.
| Table 6: | Technical efficiency score of non-participants and participants | |||
| Group | Obs | Mean | Std. Err. | Std. Dev. | Maximum | Minimum | t-value |
| Non-participants | 151 | 0.66 | 0.012 | 0.143 | 0.915 | 0.315 | |
| Participants | 153 | 0.82 | 0.007 | 0.085 | 0.957 | 0.526 | |
| Total | 304 | 0.742 | 0.008 | 0.141 | 0.957 | 0.315 | -11.74*** |
| ***Implies significant at 1% probability level. Source: own survey (2024) | |||||||
This result implies that labor, fertilizer, chemical and oxen power were the main inputs to determine the output level of maize at best practice. Furthermore, the gamma value (γ) is 0.66, which implies 66% of the total variation of maize output is due to technical inefficiency. The remained effect of variability on the potential maize yield was due to random shock, which accounts for 34%. Moreover, the result shows that the return to scale of the production process of the data was increasing returns to scale. That is, the sum of the input variables’ elasticity was 1.29, showing that a unit increase of all inputs would increase the maize output by more than one unit. This result indicates that maize production in the study area is found in stage I of production. In this stage, as the inputs increase, the output increases at an increasing rate due to the more efficient use of the variable input. The result is consistent with the previous findings28,29. Land size negatively affected maize output, in which a 1% increase in the maize land size decreases the amount of maize output by 0.22% ceteris paribus. This is because, if the land size is too large, it may be difficult to manage and maintain the maize crops effectively. This can lead to inefficiencies in the use of resources, such as water and fertilizers, which can result in a lower maize output.
Technical efficiency score among maize producers: The results in Table 6 indicated the technical efficiency results among maize cluster participants, non-participants and the total sample households. The estimated technical efficiency of the sample households ranged from 31.5% to 95.7%, with a standard deviation of 0.141. This indicates that the least efficient maize producers achieved an output that was 68.5% below the maximum potential, while the most efficient producers operated at 4.3% below the maximum possible production frontier. The minimum technical efficiency of maize cluster participants in the study area was 52.6%. This shows that the least performing of the cluster maize producers in the sample households were 47.4% less than the maximum potential yield. And the minimum technical efficiency of non-cluster participants was 31.5%, which means the least performing of non-cluster maize producers in the sample households were 68.5% less than the maximum potential output. The maximum technical efficiency of cluster participants and non-cluster participants was 95.7 and 91.5%, respectively. This means the best performing of maize producers in the study area 4.3 and 8.5% below the maximum potential possibility frontier for cluster participants and non-cluster participants, respectively.
The finding of this study reveals that the mean technical efficiency level of the sampled maize producer farmers in the study area was 74.2%, implying that the average households were producing below their potential possibility frontier level, such that there is existence of inefficiency in their production of maize. The mean value of technical efficiency shows that the level of maize output of the sample respondents can be increased on average by about 25.8% if appropriate measures are taken to improve the level of technical efficiency of maize-growing farmers.
|
In other words, it is possible to increase the yield of maize by 25.8% using the resources at their disposal in an efficient manner with the existing technology and resources. In addition, the mean technical efficiency of maize for cluster farming participants and non-participants was 82 and 66%, respectively. The mean difference among the two groups was statistically significant at 1% probability level. This result indicated that, for maize cluster participants and non-participants, it was possible to increase the maize output by 12% and 34%, respectively, without using extra inputs. The result further indicates that there exists room for improving the existing level of maize production through enhancing the level of farmers’ technical efficiency.
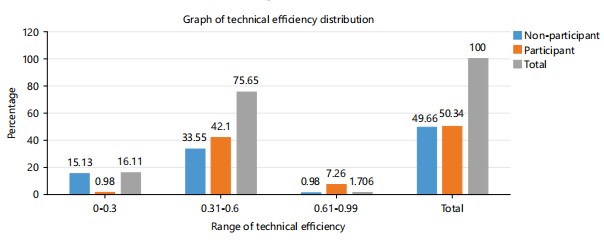
Distribution of technical efficiency score among maize producers: The technical efficiency score distribution of cluster participants and non-participants households is shows in Fig. 1. The results shows that the majority of farmers (75.65%) fall under the technical efficiency range of (0.31-0.6). This would implies that about 75.65% of the sample households in this groups have a room to enhance their maize production at least by 40%. Furthermore, smallest share of farmers’ technical efficiencies group falls under the range of (0.61-0.99) which covers 1.7%. Similarly, the second largest efficiency distribution of sampled farmers attained of technical efficiency score ranged from (0-0.3) which covers 16.11% of the efficiency score.
CONCLUSION
As a conclusion maize is one of the main crops in Ethiopia, ranking first in production and productivity and second in area coverage. However, the average maize yield in the nation is still lower than the world average. The econometric model result shown that labor, fertilizers, chemical, land size and oxen power were significant factors that determine the efficiency level of maize producers. The scale of production was found to be in the increasing return to scale. And also the study found that maize cluster farming participants had significantly higher technical efficiency as compared to non-participants. The study is significant to provide relevant information about cluster farming involvement and identify technical efficiency level of maize producers, which can benefit various stakeholders, valuable insight for policy maker and agricultural extension service to promote the adoption of maize cluster farming practices, which can lead to improved technical efficiency among smallholder maize producers. To enhance the technical efficiency of maize production and promote cluster farming, the study recommends the following to be taken in to account for the upcoming intervention strategies. First enhance support service the government body should be implement the program that provide smallholder farmers with easier access to essential input, such as fertilizers and improved seed to improve their participation in cluster farming. Second the governmental body and extension agent should focus on training and resource that specifically target to promote and improve the technical efficiency of maize producers. Finally, the governmental body together with policy maker should develop policies that incentivize non-participant farmers to join maize cluster farming.
SIGNIFICANCE STATEMENT
This study discovered the significant role of cluster farming in enhancing the technical efficiency of maize production, which can be beneficial for smallholder farmers, extension agents and policymakers striving to improve agricultural productivity in Ethiopia. By identifying key determinants such as labor, fertilizer, chemical use, land size and oxen power, the study offers valuable insights into optimizing existing resources without additional input costs. It further emphasizes that promoting cluster farming not only improves yield but also fosters knowledge sharing and collective resource use among farmers. This study will help the researchers to uncover the critical areas of input utilization and farming practices that many researchers were not able to explore. Thus, a new theory on efficiency-led agricultural transformation may be arrived at.
ACKNOWLEDGMENTS
The author would like to express their sincere gratitude to the Central Ethiopia research institution, Haramaya University and the African Economic Research Consortium for providing the necessary assistance in completing this research paper.
REFERENCES
- FAO, 2021. World Food and Agriculture. Statistical Yearbook 2021. FAO Rome, Italy, ISBN: 978-92-5-134332-6, Pages: 368.
- Degefu, S. and G. Beri, 2024. Agricultural policies and strategies in Ethiopia: A review on transformation towards an improved agricultural extension. Middle East Res. J. Agric. Food Sci., 4: 186-192.
- Kassa, Y., A. Abie, D. Mamo and T. Ayele, 2022. Exploring farmer perceptions and evaluating the performance of mung bean (Vigna radiate L) varieties in Amhara Region, Ethiopia. Heliyon, 8.
- Demissie, F., K. Yeshitila, M. Kindu and T. Schneider, 2017. Land use/land cover changes and their causes in Libokemkem District of South Gonder, Ethiopia. Remote Sens. Appl.: Soc. Environ., 8: 224-230.
- Birhanu, F.Z., A.S. Tsehay and D.A. Bimerew, 2022. Cereal production practices and technical efficiency among farm households in major ”teff” growing mixed farming areas of Ethiopia: A stochastic meta-frontier approach. Cogent Econ. Finance, 10.
- Gizaw, W. and D. Assegid, 2021. Trend of cereal crops production area and productivity, in Ethiopia. J. Cereals Oilseeds, 12: 9-17.
- Alemu, M., D. Berihun, J.C. Lokossou and B. Yismaw, 2024. Productivity and efficiency heterogeneity among maize smallholder farmers in Ethiopia. Cogent Food Agric., 10.
- Diriba, G., 2018. Agricultural and rural transformation in Ethiopia: Obstacles, triggers and reform considerations. Ethiopian J. Econ., 27: 51-110.
- van Dijk, M., T. Morley, M.L. Rau and Y. Saghai, 2021. A meta-analysis of projected global food demand and population at risk of hunger for the period 2010-2050. Nat. Food, 2: 494-501.
- Louhichi, K., U. Temursho, L. Colen and S. Gomez-y-Paloma, 2019. Upscaling the Productivity Performance of the Agricultural Commercialization Cluster Initiative in Ethiopia. Publications Office of the European Union, Luxembourg, ISBN: 978-92-76-12941-7, Pages: 88.
- Nogales, E.G. and M. Webber, 2017. Territorial Tools for Agro-Industry Development: A Sourcebook. FAO, Rome, Italy, ISBN: 978-92-5-109650-5, Pages: 398.
- Fischer, E. and M. Qaim, 2012. Linking smallholders to markets: Determinants and impacts of farmer collective action in Kenya. World Dev., 40: 1255-1268.
- Liverpool-Tasie, L.S.O., 2014. Farmer groups and input access: When membership is not enough. Food Policy, 46: 37-49.
- Joffre, O.M., P.M. Poortvliet and L. Klerkx, 2019. To cluster or not to cluster farmers? Influences on network interactions, risk perceptions, and adoption of aquaculture practices. Agric. Syst., 173: 151-160.
- Getahun, A. and D. Milkias, 2021. Review on agricultural extension systems in Ethiopia: A cluster farming approaches. J. Biol. Agric. Healthcare, 11: 1-6.
- Assefa, B.T., 2023. Maize Yield Gaps and Their Mitigation in Ethiopia: An Integrated Assessment. Wageningen University and Research, Wageningen, Netherlands, ISBN: 978-94-6447-564-7, Pages: 177.
- Belete, A.S., 2020. Analysis of technical efficiency in maize production in Guji Zone: Stochastic frontier model. Agric. Food Secur., 9.
- Mitikie, G., Y. Alamneh and D. Fentie, 2020. Technical efficiency of maize producer smallholder farmers in Alefa Woreda, North Western Ethiopia. Int. J. Afr. Asian Stud., 68: 42-48.
- Yamane, T., 1967. Statistics: An Introductory Analysis. 2nd Edn., Harper and Row, New York, Pages: 919.
- Aigner, D., C.A.K. Lovell and P. Schmidt, 1977. Formulation and estimation of stochastic frontier production function models. J. Econom., 6: 21-37.
- Meeusen, W. and J. van den Broeck, 1977. Efficiency estimation from Cobb-Douglas production functions with composed error. Int. Econ. Rev., 18: 435-444.
- Coelli, T., D.S.P. Rao and G.E. Battese, 1998. An Introduction to Efficiency and Productivity Analysis. 1st Edn., Kluwer Academic Publishers, Boston, USA, ISBN: 978-1-4615-5493-6, Pages: 276.
- Kodde, D.A. and F.C. Palm, 1986. Wald criteria for jointly testing equality and inequality restrictions. Econometrica, 54: 1243-1248.
- Bekele, Y. and G. Regasa, 2020. Technical efficiency of smallholder malt barley producers in Tiyo District (Ethiopia). Rudn J. Econ., 27: 525-535.
- Missiame, A., R.A. Nyikal and P. Irungu, 2021. What is the impact of rural bank credit access on the technical efficiency of smallholder cassava farmers in Ghana? An endogenous switching regression analysis. Heliyon, 7.
- Asfaw, M., E. Geta and F. Mitiku, 2019. Economic efficiency of smallholder farmers in wheat production: The case of Abuna Gindeberet District, Oromia National Regional State, Ethiopia. Int. J. Environ. Sci. Nat. Resour., 16: 41-51.
- Tenaye, A., 2020. Technical efficiency of smallholder agriculture in developing countries: The case of Ethiopia. Economies, 8.
- Asfaw, S., G. Pallante and A. Palma, 2020. Distributional impacts of soil erosion on agricultural productivity and welfare in Malawi. Ecol. Econ., 177.
- Tesfaw, Z., L. Zemedu and B. Tegegn, 2021. Technical efficiency of Teff producer farmers in Raya Kobo District, Amhara National Regional State, Ethiopia. Cogent Food Agric., 7.
How to Cite this paper?
APA-7 Style
Abdo,
H., Sileshi,
M., Shiferaw,
S. (2025). Technical Efficiency Differences between Cluster Farming Participants and Non-Participants among Maize Producers in Silti District, Ethiopia. Trends in Agricultural Sciences, 4(3), 229-240. https://doi.org/10.17311/tas.2025.229.240
ACS Style
Abdo,
H.; Sileshi,
M.; Shiferaw,
S. Technical Efficiency Differences between Cluster Farming Participants and Non-Participants among Maize Producers in Silti District, Ethiopia. Trends Agric. Sci 2025, 4, 229-240. https://doi.org/10.17311/tas.2025.229.240
AMA Style
Abdo
H, Sileshi
M, Shiferaw
S. Technical Efficiency Differences between Cluster Farming Participants and Non-Participants among Maize Producers in Silti District, Ethiopia. Trends in Agricultural Sciences. 2025; 4(3): 229-240. https://doi.org/10.17311/tas.2025.229.240
Chicago/Turabian Style
Abdo, Haider, Miilion Sileshi, and Sime Shiferaw.
2025. "Technical Efficiency Differences between Cluster Farming Participants and Non-Participants among Maize Producers in Silti District, Ethiopia" Trends in Agricultural Sciences 4, no. 3: 229-240. https://doi.org/10.17311/tas.2025.229.240

This work is licensed under a Creative Commons Attribution 4.0 International License.