Husbandry Practices, Constraints, and Opportunities in Indigenous Chicken Production in the Siltie Zone, Central Ethiopia
-
Yesuf Kedalla Aman

Central Ethiopia Agricultural Research Institute, Worabe Agricultural Research Center, Worabe, P.O. Box 21, Ethiopia
Kefyalew Berihun Reda
School of Animal and Range Sciences, Hawassa University, P.O. Box 05, Ethiopia
| Received 07 Apr, 2025 |
Accepted 28 Jun, 2025 |
Published 30 Jun, 2025 |
Background and Objective: Chicken production is one of the livestock subsectors in Ethiopia, and it plays an important role in job creation, family nutrition improvement, and women’s empowerment. The present study was conducted to assess the husbandry practices, constraints, and opportunities of indigenous chickens in different agroecologies of the Siltie Zone, Central Ethiopia Region of Ethiopia. Materials and Methods: The study was conducted in the highland and midland agroecologies of the Siltie Zone. A total of four districts were purposively selected based on the potential of the indigenous chicken population and agroecology. In each district, 40 households that have more than five adult indigenous chickens were selected using a simple random sampling technique. Data were collected on indigenous chicken house and housing; feeding (feed availability, types, and frequency of feeding), watering (availability and frequency of watering), marketing, disease and health care practices, and breeding and culling practices. Descriptive statistics, including means and percentages of indigenous chicken data, were analyzed using SPSS software at a 0.05 significance level. Results: The study revealed that there was a significant difference (p<0.05) for housing, feeding management, watering management, marketing, health care practices, breeding, and culling practices among the two agroecologies in the study area. Conclusion: Indigenous chicken production and husbandry practices are relatively better in the midland than in the highland agro ecology in the study area, which might be due to better awareness in feed supplementation, watering, culling, and selection practices of indigenous chicken in the midland agro ecology in the study area.
| Copyright © 2025 Aman and Reda. This is an open-access article distributed under the Creative Commons Attribution License, which permits unrestricted use, distribution, and reproduction in any medium, provided the original work is properly cited. |
INTRODUCTION
The number of chickens in the world is estimated to be 25.9 billion, and global egg production has continuously increased over the last few decades; chicken production exceeded 1,577 billion eggs in 2019 FAO1. In Ethiopia, there are approximately 57 million chickens, with 78.85% (44,940,924), 12.02% (6,857,718), and 9.11% (5,194,345) of all chickens being indigenous, hybrid, and exotic, respectively Abraham2. Among the whole population of chickens in Ethiopia, 99% are raised under the traditional backyard system of management, while 1% is raised under an intensive management system. Commercial chicken production in the sector comprises only 1-2% of the nation’s chickens in Ethiopia, Gebremariam and Girma3.
Chicken production is one of the livestock subsectors in Ethiopia, and it plays an important role in job creation, family nutrition improvement, and women’s empowerment. This is a suitable enterprise for poor households because of the small amount of land required and the low investment costs involved in starting and managing the farm, as reported by FAO1. The authors Bekele et al.4 stated that monogenetic factors such as feeding, housing, healthcare, and other management practices have a much greater impact on production than do genetics under a scavenging system of production.
According to Abraham2 the traditional and improved family poultry production systems target smallholder farmers who can utilize potential feed resources locally. Most poultry products (88.5%) are obtained from conventional family poultry production systems.
The objective of this study is to examine the husbandry practices, identify the major constraints, and explore potential opportunities for enhancing indigenous chicken production in the Siltie Zone, Central Ethiopia, with a focus on improving productivity, sustainability, and the socio-economic benefits for local farmers.
MATERIALS AND METHODS
Study area description: The study was conducted Siltie Zone of two agro-ecologies from December, 2022 to February, 2024. Siltie Zone borders the Hadiya Zone to the South, the Gurage Zone to the North and Northwest, the Oromia Region to the East, and the Halaba Zone to the Southeast. Worabe is the capital town and is located 172 km South of Addis Ababa. Siltie Zone is one of the central zones of the region, with large plains, mountains, and plateaus. The coordinates of Siltie Zone are a latitude of 8°1'0"N and a longitude of 38°19'60"E, and it is located at an elevation of 1,500-3,700 m.a.s.l.
The study area has two different agro-climatic zones: Highland or Dega (20.5%) and midland or Weyna-Dega (79.5%). The average temperature ranges from 12-26°C, and the average annual rainfall ranges from 780-1,818 mm, as reported by Bekele et al.5.
In the Siltie Zone, there are approximately 646,525 chickens, of which 71.43% (461,833) are indigenous, 26.2% (169,452) are hybrid chickens, and 2.36% (15,240) are exotic chickens, as reported by Jemberu et al.6. The main economic source of livelihood is a mixed farming system, with agriculture being the primary economic activity. The major crops grown in the Siltie Zone include barley, maize, sorghum, enset, and vegetables. The livestock reared in the study area include cattle, sheep, goats, chickens, and equines, as reported by Bekele et al.5.
Sampling design and data collection procedures: The study was conducted in the highland and midland agroecologies of the Siltie Zone. A total of four districts were selected: from the highland, Alicho and Misrak Azernet Districts; and from the midland, Dalocha and Wulbareg districts. were purposively selected based on the potential of the indigenous chicken population and the agroecology of the study area. A total of eight kebeles and two Kebeles from each district were selected purposively based on the potential of the indigenous chicken population and accessibility for data collection. From each kebele, 40 households with more than five adult local chickens were selected using a simple random sampling technique with the collaboration of district and kebele livestock experts. Households producing exotic chicken or their crosses in the neighborhood were excluded to avoid the risk of sampling. Hence, a total of 320 households were selected in the study area.
Data collection procedures: The study was accomplished through interviews using pretested, reframed, semi-structured questionnaires, and the interviews were conducted at the farmers’ houses. Data on indigenous chicken husbandry practices such as house and housing; feeding (feed availability, types, and frequency of feeding), watering (availability and frequency of watering), marketing, disease and health care practices, and breeding and culling practices were collected.
In the data collection methods, one focus group discussion was held in each kebele, and secondary data were collected from different sources and zone and district-level reports. Participants were asked to rank their first, second, third, fourth, and fifth major-ranked data parameters.
Statistical analysis: Descriptive statistics, such as the means and percentages of indigenous chicken data, were analyzed using SPSS software, version7.
The indices were calculated for the ranked variables by using the following formula:
as the sum of [(5* No. of HH ranked first) (4* No. of HH ranked second)+(3* No. of HH ranked third)+ (2* No. of HH ranked fourth)+(1* No. of HH ranked fifth)] for individual criteria or practices divided by the sum of [(5* number of household ranked first)+(4* number of household ranked second)+(3* number of household ranked third)+(4* No. of HH ranked fourth)+(5* No. of HH ranked first)] for overall attributes using the formula of Musa et al.8.
The statistical model used for quantitative data measurements of indigenous chicken was:
Where:
| Yijk | = | Corresponding quantitative trait of indigenous chicken in ith agro-ecology of jth sex (j = 2, male and female) | |
| μ | = | Overall population mean for the corresponding quantitative trait | |
| Ai | = | Effect of ith agro-ecology (i = 2, midland and highland) | |
| eijk | = | Random error |
Ethics statement: The research presented in this manuscript, entitled “Husbandry Practices, Constraints, and Opportunities in Indigenous Chicken Production in Siltie Zone, Central Ethiopia” has been conducted with adherence to ethical guidelines and regulations as outlined by the Institutional Review Board (IRB) at Hawassa University, Ethiopia,by the ethical principles of the declaration.
RESULTS AND DISCUSSION
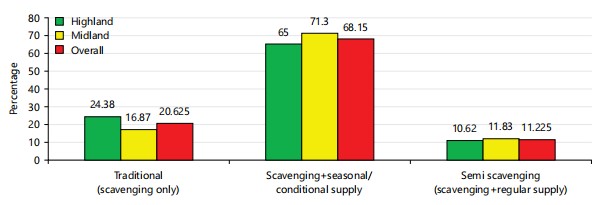
Indigenous chicken production systems in the study area: The type of indigenous chicken production system in the study area was a traditional production system with or without feed supplementation, as summarized in Fig. 1. As 65% of the indigenous chicken production system in the highlands and 71.3% in the midland agro-ecology, with a total mean of 68.15%, were managed in traditional or scavenging production systems with seasonal or conditional supplementation of available feed resources, which was better in the midlands agro-ecology. Approximately 20.63% of households in the study area rear indigenous chicken without providing any supplementary feed resources or scavenging systems, mainly in the highland agroecology. In contrast, 10.62% of the highland agro ecology and 11.83% of the midland agro ecology, with an overall mean of 11.23%, were practiced semi-scavenging systems or scavenging systems with regular supplementation of feed resources, which was also better in the midland agro ecology in the study area. In general, more than 79.38% of the chicken production system in the study area was a free-range/traditional production system with a small amount of seasonal or regular supplementation of available feed resources, which was better in the midland agroecology. The study was in line with the report of Yihun9 , who reported that the majority of households in the Awi Zone of the Amhara Regional State of Ethiopia practiced backyard chicken production systems, accounting for approximately 73.3% of the households, and Alemayehu et al.10, who stated that chicken production systems in Benishangul-Gumuz include the free-range system or traditional village chicken production system, the backyard or subsistence system, the semi-intensive system and the small-scale intensive system production system.
|
| Table 1: | Purpose of indigenous chicken production in the study area | |||
| Agro ecology | |||||||||||
| HL (N = 160) | ML (N = 160) | ||||||||||
| Purposes of chicken production | R1 | R2 | R3 | R4 | Indices | R1 | R2 | R3 | R4 | Indices | Overall Indices |
| Source of income | 103 | 43 | 10 | 4 | 0.342 | 98 | 41 | 13 | 8 | 0.35 | 0.349 |
| Consumption | 33 | 67 | 46 | 14 | 0.270 | 36 | 61 | 52 | 11 | 0.28 | 0.275 |
| Reproduction | 8 | 59 | 36 | 57 | 0.21 | 4 | 31 | 72 | 53 | 0.19 | 0.200 |
| Cultural/religious | 6 | 24 | 61 | 69 | 0.176 | 9 | 21 | 45 | 85 | 0.17 | 0.173 |
| Sum | 150 | 193 | 153 | 144 | 1 | 147 | 154 | 182 | 157 | 1 | 1 |
| R1-R4: Rank 1-4, HL: Highland, ML: Midland and N: Sample size | |||||||||||
Indigenous chicken husbandry practices
Purpose of indigenous chicken production: The purpose of indigenous chicken production in the study area was mainly for the source of income (1st), egg and meat consumption (2nd), flock replacement or reproduction (3rd), and cultural/religious ceremonies (4th) for chicken production (Table 1). Generally, households rear indigenous chicken to receive cash income from the sale of chicken and eggs, which are used to purchase food and immediate cash needs such as salt, coffee, spices, and other materials for home consumption, and used to purchase agricultural inputs. This indicated that indigenous chicken production supports food security and financial contributions to support chicken owners in the study area. This result was in agreement with a previous report Moges et al.11, in the Bure District, which reported that chicken reproduction or flock replacement (45%), chicken meat and egg consumption (44%), ceremonies (36.4%) and egg production (40.7%) in North western Ethiopia, and Markos et al.12 reported that, for income purposes (1st) and ceremonies (2nd) were the first two priorities of indigenous chicken production in the Western Zone of Tigray, Northern Ethiopia.
Indigenous chicken housing and management practices: The current study showed that the number of indigenous chickens that shared the same house with households with night shelters (perch) in the highland was significantly (p<0.05) greater than in the midlands agro ecology but the number households of those providing night shelters only (perch) was significantly (p<0.05) greater in the midlands than in the highland agro ecology. The current results agree with the findings of Moges et al.11, who indicated that in the Bure District of Northwest Ethiopia, 77.9% of village chicken owners provide only night shelters, but the finding is inconsistent with the finding that only 22.1% of village chicken owners provide a separate chicken house. No households purposely constructed chicken houses for their indigenous chickens; rather, 9.07% of the households constructed daytime shelters with either locally available materials or chicken wire mesh, especially to protect young chicks from predators and to protect home garden vegetables from chicken damage, which was better in the midland agro ecology. The reasons why chicken owners did not construct indigenous chicken separate houses were, due to lack of attention for indigenous chicken, lack of human power and a small flock size, which were significantly (p<0.05) greater in the highland agro ecology, whereas a shortage of materials for the construction of chicken houses was significantly (p<0.05) greater in the midland agro ecology (Table 2). The reason might be in the highland, where young boys and girls migrated to urban areas, and in the midland agro ecology, there might be a lack of construction materials due to a small quantity of trees in the study area.
| Table 2: | Indigenous chicken housing and management system in the study area | |||
| Agro-ecology | ||||||
| HL | ML | Overall (%) | ||||
| House and housing system | N = 160 | Percentage | N = 160 | Percentage | N = 320 | p-value |
| Housing conditions for indigenous chicken | ||||||
| Share a house with HHs | 134 | 83.75a | 109 | 68.13b | 75.93 | 0.0001 |
| Providing night shelter only | 16 | 10.00b | 40 | 25.00a | 17.5 | 0.0001 |
| Provide a night shelter in the livestock house | 10 | 6.25 | 11 | 6.875 | 6.56 | 0.099 |
| Construct a chicken house? | ||||||
| Yes | 0 | 0 | 0 | 0 | 0 | 1 |
| No | 160 | 100 | 160 | 100 | 100 | 1 |
| Construct a daytime shelter | ||||||
| Yes | 12 | 7.50b | 17 | 10.63a | 9.016 | 0.0001 |
| No | 148 | 92.50a | 143 | 89.38b | 90.94 | 0.0001 |
| Why not construct a separate house? | ||||||
| Lack of attention | 76 | 47.50a | 65 | 40.63b | 44.18 | 0.0001 |
| Shortage of materials | 22 | 13.75b | 73 | 45.63a | 29.41 | 0.0001 |
| Lack of manpower | 30 | 18.75a | 5 | 3.125b | 10.92 | 0.0001 |
| Due to the small flock size | 32 | 20.00b | 17 | 10.63a | 15.49 | 0.0001 |
| HL: Highland, ML: Midland, N: Sample size and a,bRow means significantly different at p<0.05 | ||||||
Responsibility of household members for chicken management: Households responsible for chicken production (feeding, watering, marketing, egg collection, and other practices) were managed by women, young females, and young males (Table 3). The table presents the distribution of household (HH) responsibilities among different demographic groups (young males, young females, men, women, and elders) across two agro-ecological zones: HL (highland) and ML (midland), each with 160 respondents. Responsibilities are categorized into five ranks (R1-R5), with corresponding indices indicating each group’s relative involvement. Women and young females show higher responsibility indices in both zones, whereas elders have the lowest involvement. Overall, HL exhibits slightly higher total indices for women and young females, while ML shows increased participation from men.
The reasons might be that chickens do not need more labor for handling and marketing, and most of the adult men in the study area participated in agricultural cultivation activities. The current results were in line with those of Abubakar et al.13 and Melak et al.14, who revealed that in Sub-Saharan Africa, 85% of all families raise chickens on a free-range system, 70% of which are women, and that their production serves as a valuable supply of animal protein in the form of meat and eggs, as well as a reliable source of monetary income in rural and urban areas. Duguma15 reported that taking care of chickens in Guder Town of the Oromia Region was done primarily by women (52.5%), followed by men (25%) and children (22.5%).
Indigenous chicken feed and feeding management: The majority of chicken owners provided supplementary feeds for their indigenous chickens (Table 4). The provision of supplementary feed resources in the midlands was significantly greater (p<0.05) than that in the highlands. The reason might be the availability of better cereal grains, leftover feed, and grinding mills left over feed in the midland agro ecology in the study area. The results of the present study were in agreement with previous study of Melak et al.14 reported that 85% of the farmers offered supplementary feeds for their chickens with some kind of feeds in addition to scavenging in the Awi Zone; however, this percentage was higher than Duguma15, who reported that only 37.5% of the respondents supplemented their indigenous chickens in urban and peri-urban areas of the Guder town of the Oromia Region, Ethiopia.
| Table 3: | Responsibilities of the households for chicken management in the study area | |||
| Agro-ecology | |||||||||||||
| HL (N = 160) | ML (N = 160) | ||||||||||||
| HH responsibility | R1 | R2 | R3 | R4 | R5 | Indices | R1 | R2 | R3 | R4 | R5 | Indices | Overall Indices |
| Young males | 43 | 42 | 35 | 15 | 25 | 0.22 | 37 | 42 | 38 | 16 | 27 | 0.203 | 0.212 |
| Young females | 54 | 38 | 44 | 13 | 11 | 0.24 | 39 | 46 | 41 | 23 | 11 | 0.215 | 0.227 |
| Men | 13 | 35 | 43 | 51 | 18 | 0.17 | 62 | 43 | 23 | 17 | 15 | 0.231 | 0.200 |
| Women | 66 | 51 | 19 | 13 | 11 | 0.25 | 56 | 37 | 33 | 11 | 23 | 0.219 | 0.235 |
| Elders | 7 | 10 | 8 | 55 | 80 | 0.12 | 13 | 17 | 15 | 51 | 64 | 0.132 | 0.126 |
| Sum | 183 | 176 | 149 | 147 | 145 | 1 | 207 | 185 | 150 | 118 | 140 | 1 | 1 |
| R: Rank, R1-R5: Rank 1-5, N: Sample size, HL: Highland and Ml: Midland agro ecology | |||||||||||||
| Table 4: | Indigenous chicken feed and feeding management practices in the study area | |||
| Agro-ecology | ||||||
| HL | ML | Overall (%) | ||||
| Feed and feeding | N = 160 | Percentage | N = 160 | Percentage | N = 320 | p-value |
| Supplement feeds? | ||||||
| Yes | 121 | 75.63b | 133 | 83.13a | 79.38 | 0.0001 |
| No | 39 | 24.38a | 27 | 16.87b | 20.62 | 0.0001 |
| In which season do you frequently supplement feeds? | ||||||
| July to September | 12 | 9.92b | 22 | 16.54a | 13.23 | 0.0001 |
| October to December | 53 | 43.80b | 73 | 54.89a | 49.35 | 0.0001 |
| April to June | 8 | 6.61b | 20 | 15.04a | 10.83 | 0.0001 |
| January to March | 48 | 39.67a | 18 | 13.53b | 26.6 | 0.0001 |
| Frequency of feeding? | ||||||
| Once | 100 | 82.65a | 85 | 63.91b | 73.28 | 0.0001 |
| Twice | 21 | 17.35b | 48 | 36.09a | 26.72 | 0.0001 |
| Ways of supplementation | ||||||
| To different classes | 43 | 35.54 | 49 | 36.84 | 36.19 | 0.139 |
| Together whole group | 78 | 64.46 | 84 | 63.16 | 63.81 | 0.139 |
| Supplemented chicken age group | ||||||
| Young and broody hens | 17 | 14.05 | 19 | 14.29 | 14.17 | 0.783 |
| Layers hens | 40 | 33.06b | 48 | 36.09a | 34.58 | 0.0008 |
| Cockerels and pullets | 14 | 11.57b | 30 | 22.56a | 17.07 | 0.0001 |
| All age group together | 50 | 41.32a | 36 | 27.07b | 34.2 | 0.0001 |
| Time of supplementation | ||||||
| At morning scavenging | 56 | 46.28a | 44 | 33.08b | 39.68 | 0.0001 |
| Morning and during the day | 8 | 6.61b | 47 | 35.34a | 20.98 | 0.0001 |
| Any time during the day | 57 | 47.11a | 42 | 31.58b | 39.35 | 0.0001 |
| Reasons for supplementary feeds? | ||||||
| Egg yield | 36 | 29.75b | 47 | 35.34a | 32.55 | 0.0001 |
| Broody hen | 17 | 14.05b | 25 | 18.79a | 16.42 | 0.0001 |
| Egg, meat, and broody hens | 68 | 56.19a | 61 | 45.87b | 51.03 | 0.0001 |
| Type of supplementary feed? | ||||||
| Cereal grains | 7 | 5.785b | 25 | 18.79a | 12.29 | 0.0001 |
| Leftover foods | 8 | 6.612b | 31 | 23.30a | 14.96 | 0.0001 |
| Kitchen waste | 5 | 4.13b | 15 | 11.28a | 7.705 | 0.0001 |
| grains, kitchen, and leftovers | 101 | 83.47a | 62 | 46.62b | 65.05 | 0.0001 |
| Source of feed for local chicken | ||||||
| From own house | 102 | 84.29a | 107 | 80.45b | 82.37 | 0.0001 |
| From industrial by-products | 8 | 6.61 | 8 | 6.015 | 6.313 | 0.496 |
| From the grinding mill leftover | 11 | 9.09b | 18 | 13.53a | 11.31 | 0.0001 |
| How do you provide the feed? | ||||||
| On the container | 43 | 35.54a | 40 | 30.07b | 32.8 | 0.0001 |
| On the floor and ground | 78 | 64.46b | 93 | 69.93a | 67.2 | 0.0001 |
| HL: Highlands, ML: Midlands, N: Sample size, and a,bRow means with different subscript letters are significantly different (p<0.05) | ||||||
Chicken owners provided supplementary feeds for layer hens, and the proportions of cockerels and pullets in the midland were significantly (p<0.05) greater than those in the highland agro ecology but the proportion of feed supplemented to the whole group was greater in the highland agro ecology (Table 4). The variation might be due to the experience of the chicken owners, which may differ from agro-ecology to agro-ecology, even from farmer to farmer. Regarding the frequency of feeding, 73.28% of the chicken owners provided supplementary feed once a day, and 26.72% provided it twice a day. The current results were inconsistent with the report of Duguma15, who reported that 100% of respondents offered food once per day. The number of chicken owners providing supplementary feed for their chickens in containers was significantly greater (p<0.05) in the highland than midland agro ecology. The variation in the feeder materials used in different agroecologies might be due to differences in the efficiency of the use of supplementary feeds, the availability and type of feeder materials, and the differences in the feeding practices of the chicken owners. The results of the present study were consistent with those of Worku et al.16, who reported that only 16.3% of the households used feeding equipment to provide supplementary feeds, while 83.7% of the chicken owners spread the feeds simply on the ground for all age groups in the West Amhara Region of Ethiopia. A total of 51.03% of the households supplemented the feed resources for indigenous chicken to increase the production performance of chicken (egg, meat and broody hens), 32.55% to increase the egg yield, and 16.42% to manage broody hens and young chicks to reduce the mortality of chicks and increase the growth performance of young chicks. The type of supplementary feed available for indigenous chicken in the midland was significantly (p<0.05) greater than that in the highland, except for all feeds (grains, kitchen and leftover feed), which were more abundant in highland agro ecology. The variation might be due to the availability and type of feed resources in different agro ecologies in the study area.
Concerning the sources of feed for indigenous chicken, 82.37% of respondents owned any available feed resources (maize, wheat, sorghum, barley, Enset corm “Amicho”, leftover and waste feeds), 11.31% were purchased from grinding mill leftover feeds, and 6.31% were purchased from industrial products such as wheat bran and residual or screened wheat mixed with soil (locally known as “Afericha”). The sources of feed for indigenous chicken purchased from grinding mill leftover feeds were significantly (p<0.05) greater in the midland agro ecology. The type of supplementary feed variation might be due to the agricultural practices and availability of grinding mill plants in the study area. These results are in line with those of Moges et al.11, who reported that cereal grains (maize and sorghum) and household scraps were the major supplementary feeds. The amount of supplemented feed resources was dependent on the season of the year and the quantity and availability of the feed resources at the farmer level in Gomma Woreda.
Water sources and watering management for indigenous chickens: Water is essential for feed digestion and metabolic activity in indigenous chickens. The study results indicated that the sources of water that the respondents used for watering indigenous chicken were river water, ground water and spring water (p<0.05), which were significantly greater in the highland than in the midland, while pond water and tap water were significantly (p<0.05) more common in the midland agro ecology in the study area. The variation might be due to the agroecological difference, difference in availability and sources of water in the study area. Providing water for indigenous chicken was significantly (p<0.05) greater in the midland agroecology. However, 14.68% of the chicken owners did not purposely provide water for their indigenous chicken; those chickens that did not receive water from the owners might obtain water from their digested feeds, from splashed water, and water provision for other animals, and the remaining water from other animals. The results of the current study were in agreement with the report of Yihun9, who reported that 93.33% of respondents provided water to their chicken and that 6.67% did not provide water. Most of the chicken owners (94.84%) provided water in the dry season, and 5.13% provided water year-round; the percentage of chicken owners who provided water in the dry season was greater in the highland, but the percentage of those who provided water year-round was greater in the midland agro ecology (Table 5). The results of the present study were nearly consistent with the findings of Worku et al.16, who reported that 86.2% of the population provided water during the dry season, 3.6% during the wet season, and 10.2% year-round in Northwestern Ethiopia.
| Table 5: | Water sources and watering management for indigenous chicken in the study area | |||
| Agro-ecology | ||||||
| HL | ML | Overall | ||||
| Sources of water and watering | N = 160 | Percentage | N = 160 | Percentage | N = 320 (%) | p-value |
| Do you provide water? | ||||||
| Yes | 135 | 84.38b | 138 | 86.25a | 85.31 | 0.0001 |
| No | 25 | 15.6a | 22 | 13.75b | 14.68 | 0.0001 |
| Which season of the year | ||||||
| Dry season | 132 | 97.77a | 127 | 92.03b | 94.84 | 0.0001 |
| Year round | 3 | 2.17b | 11 | 8.10a | 5.135 | 0.0001 |
| Frequency of watering | ||||||
| Once | 32 | 23.19b | 76 | 56.20a | 39.7 | 0.0001 |
| Twice | 100 | 74.07a | 46 | 33.33b | 53.25 | 0.0001 |
| ad libitum | 3 | 2.17b | 16 | 11.85a | 7.01 | 0.0001 |
| Source of water | ||||||
| River | 61 | 44.20a | 3 | 2.22b | 22.21 | 0.0001 |
| Tap water | 13 | 9.42b | 58 | 42.96a | 26.19 | 0.0001 |
| Ground and spring | 56 | 41.48a | 3 | 0.02b | 21.38 | 0.0001 |
| pond water | 5 | 3.62b | 74 | 54.81a | 29.22 | 0.0001 |
| Watering trough | ||||||
| Yes | 135 | 100 | 138 | 100 | 100 | 1 |
| Type of watering trough | ||||||
| Plastic materials | 115 | 85.18a | 89 | 64.49b | 74.6 | 0.0001 |
| Earthen pot | 11 | 7.97b | 32 | 23.70a | 15.84 | 0.0001 |
| Unused casserole | 9 | 6.50b | 17 | 12.59a | 9.545 | 0.0001 |
| HL: Highland, ML: Midland and N: Number of samples | ||||||
| Table 6: | Selection criteria for eggs incubated in the study area | |||
| Agro ecology | |||||||||||||
| HL (N = 160) | ML (N = 160) | ||||||||||||
| Egg selection criteria | R1 | R2 | R3 | R4 | R5 | Indices | R1 | R2 | R3 | R4 | R5 | Indices | Overall Indices |
| Large-sized eggs | 14 | 33 | 42 | 62 | 9 | 0.24 | 23 | 27 | 45 | 49 | 16 | 0.19 | 0.215 |
| Medium size | 22 | 32 | 26 | 39 | 41 | 0.16 | 27 | 22 | 30 | 37 | 44 | 0.17 | 0.166 |
| Small-sized eggs | 18 | 27 | 21 | 38 | 56 | 0.14 | 13 | 29 | 26 | 37 | 55 | 0.16 | 0.15 |
| Cleanness | 50 | 39 | 24 | 31 | 16 | 0.2 | 47 | 34 | 21 | 38 | 20 | 0.21 | 0.208 |
| Crackles of eggs | 96 | 38 | 26 | 0 | 0 | 0.26 | 82 | 31 | 27 | 17 | 3 | 0.26 | 0.261 |
| Sum | 200 | 169 | 139 | 170 | 122 | 1 | 192 | 143 | 149 | 178 | 138 | 1 | 1 |
| R1-R5: Rank 1-5, HL: Highland, ML: Midland and N: Number of samples | |||||||||||||
Approximately 39.7% of the respondents provided water once a day, 53.25% twice a day, and only 7.01% of the chicken owners offered water-free access or ad libitum throughout the day. This percentage was lower than that reported by Duguma15, who reported that 45% of respondents offered water ad libitum, 40% offered water three times a day and 15% offered water twice a day, and Yihun9, who reported that chicken owners provided water ad libitum, three times per day, twice per day and once per day (85.71, 8.93, 3.57 and 1.79%, respectively) in the Awi Zone of the Amhara Region.
Selection of eggs for incubation: The large size of eggs selected by the chicken owners might be due to their ability to hatch the best young chicks, which was linked to the genetic improvement of the indigenous chickens (Table 6).
Table presents farmers’ preferences for egg selection criteria in highland (HL) and midland (ML) zones (N = 160 each). Crack-free eggs ranked highest in both zones with the highest index (0.26), indicating their top priority. Large-size eggs were the second most preferred (overall index = 0.215), followed by cleanliness (0.208). Medium and small-sized eggs had lower preference, with indices of 0.166 and 0.150, respectively. Preferences were generally consistent across both agro-ecologies, with minor variations in ranking order.
| Table 7: | Egg hatching and brooding practices in the study area | |||
| Agro-ecology | ||||||
| HL | ML | |||||
| Hatching and brooding practices | N = 160 | Percentage | N = 160 | Percentage | Overall (%) | p-value |
| Mix eggs obtained from different hens? | ||||||
| Yes | 53 | 33.13b | 60 | 37.50a | 35.31 | 0.0001 |
| No | 107 | 66.87a | 100 | 62.50b | 64.69 | 0.0001 |
| Preferred months to set eggs for hatching | ||||||
| September to January | 17 | 10.63b | 20 | 12.50a | 11.56 | 0.0044 |
| September to February | 30 | 18.75b | 34 | 21.25a | 20 | 0.0001 |
| October to April | 57 | 35.63a | 50 | 31.25b | 33.44 | 0.0001 |
| September to May | 56 | 35 | 56 | 35 | 35 | 1 |
| Reasons to prefer eggs this month? | ||||||
| High hatchability | 25 | 15.63b | 34 | 21.25a | 18.44 | 0.0001 |
| Good Temperature | 11 | 6.875b | 40 | 25.00a | 15.94 | 0.0001 |
| Availability of feed sources | 60 | 37.50a | 42 | 26.25b | 31.88 | 0.0001 |
| Low mortality and predator | 64 | 40.00a | 44 | 27.50b | 33.75 | 0.0001 |
| Why do you not sit in these other months? | ||||||
| Low hatchability | 25 | 15.63a | 18 | 11.25b | 13.44 | 0.0001 |
| Cold temperature | 35 | 21.88a | 30 | 18.75b | 20.31 | 0.0001 |
| Feed shortage | 25 | 15.63b | 60 | 37.50a | 26.56 | 0.0001 |
| High mortality and predator | 75 | 46.88a | 52 | 32.50b | 39.69 | 0.0001 |
| Bedding materials used during incubation | ||||||
| Straw (teff, wheat, and barley) | 127 | 79.38b | 155 | 96.88a | 88.13 | 0.0001 |
| chopped dry grasses | 33 | 20.62a | 5 | 3.125b | 11.88 | 0.0001 |
| What material do you use during incubation? | ||||||
| Wooden and plastic materials | 92 | 57.50b | 98 | 61.25a | 59.38 | 0.0001 |
| bamboo basket | 68 | 42.50a | 62 | 38.75b | 40.63 | 0.0001 |
| Local practices used to avoid broodiness? | ||||||
| Hanging a hen upside-down | 4 | 2.50b | 42 | 26.25a | 14.38 | 0.0001 |
| Disturbing broody hen | 7 | 4.375 | 8 | 5 | 4.688 | 0.327 |
| Taking to another place | 16 | 10.00a | 5 | 3.125b | 6.563 | 0.0001 |
| Taking away broody nest | 53 | 33.13b | 58 | 36.25a | 34.69 | 0.0001 |
| Tie wings of chicken | 80 | 50.00a | 47 | 29.38b | 39.69 | 0.0001 |
| HL: Highland, ML: Midlands, N: Number of samples and a,bRow means with different subscript letters are significantly different (p<0.05) | ||||||
The last-ranked criterion was used as the last egg selection criterion for incubation; if there were no eggs for the selection, small eggs were used. This result was comparable to the findings of Lemma et al.17, who reported that respondents select eggs based on the size of the egg in lowlands (44.9%) and both the color and size in mid-(45.7%) and highland (54.4%). Large and white eggs were prioritized on lowland (53.7%), midland (60%), and highland (59.5%) areas in Eastern Ethiopia.
Hatching and brooding practices in the study area: The study indicated that 64.69% of the respondents stored eggs separately, and 35.31% of eggs were mixed and obtained from different hens. There was a significantly greater percentage of mixed eggs obtained from different hens in the study area (p<0.05) in the midland than in the highland agro ecology, which could affect the percentage of hatched eggs due to difficulty in separating early and long-stored eggs at the time of egg setting for incubation. Eggs obtained from different hens should be stored separately.
Generally, the preferred months for hatching eggs were from September to May. The reasons for these results were primarily the low mortality and low predator attack of young chicks (33.75%), the dry season might be an environmentally friendly temperature for young chicks and grown crops, which are used as shelters for predators during the wet season and harvested during the dry season from September to May. Second, availability of feed resources (31.88%), third, farmers achieve high hatchability of eggs regardless of other factors (18.44%), and fourth, good environmental temperature (15.94%), as summarized in Table 7. Most of the chicken owners did not prefer months from June to August; the reasons might be the reverse of the above reasons and mainly the high mortality of chicks and high predator prevalence from June to August (39.69%) and low feed availability (26.56%), cold environmental temperature (20.31%) and low hatchability rate (13.44%) in response to the sampled chicken owners in the study area (Table 7). The current result was in agreement with the findings of Lemma et al.17, who reported that the hatching of eggs was preferred during the dry season in Eastern Ethiopia. The reasons for this difference were seasonal variability in hatchability (74.3%), from the respondents’ responses in the lowlands (90.7%), midlands (72.3%) and highland (68.7%), which had better hatchability during the dry season, in the lowlands (93.9%), midlands (70.2%) and highland (70.7%) in Eastern Ethiopia.
The chicken owners practiced different local methods to avoid the broodiness of indigenous hens after the end of the clutch. The reasons might be the increase in the number of eggs produced per year per hen, and the other reasons might be the lack of available eggs for incubation for broody hens (the eggs might be sold or consumed by chicken owners), during which the time might not be preferred for the incubation of eggs due to cold environmental temperatures or feed shortages during the wet season. Chickens that were taken to other places far from their home were significantly greater (p<0.05) in the highland, but chickens that were hung the broody hen upside-down and removed the broody nest were significantly greater (p<0.05) in the midland agro ecology in the study area. This finding was consistent with a previous report that reported techniques to avoid broodiness included handing chickens in lowlands (53.3%), midlands (34.4%) and highland (23.3%), followed by disturbing nests in lowlands (25%) and highland (21.3%), and both disturbing nests and hanging hens to leave while disturbing nests in Eastern Ethiopia. The variation in hatching and brooding practices between the two agroecologies might be due to differences in environmental temperature, husbandry practices of chicken, and the availability of materials in the study area.
Health management practices: Mortality of chickens due to management problems and predator attacks was significantly (p<0.05) greater in the highland agro ecology; however, the mortality of chickens due to disease and unknown causes was significantly (p<0.05) greater in the midland agro ecology (Table 8). The variation might be due to the prevalence of predators in different agro ecology agroecology and the farmers’ management practices in the study area. The most prevalent diseases in the study area were Newcastle disease (93.29%) and fowl pox disease (6.72%), which were identified by the disease symptoms reported by the chicken owners in the study area. The results of the present study were higher than the findings of Dinka et al.18, who revealed that, losses attributed to Newcastle disease are estimated at approximately 57.3% of the overall annual chicken mortality, whereas fowl pox, coccidiosis, and predation account for approximately 31.6, 9.4 and 1.7% of the total annual chicken mortality, respectively.
Modern control and treatment measures used in the highland were significantly (p<0.05) greater than those used in the midland agro ecology, but traditional control and treatment measures were significantly (p<0.05) greater in the midland agro ecology (Table 8). The variation might be due to the awareness of the chicken owners of modern control and treatment measures, the difference in management practices, the availability of a veterinary clinic centre near the chicken owners, and the availability of traditional medicinal plants used in the study area. This result was inconsistent with the report of Duguma15, who reported that 37% of the respondents carried out scientific disease control practices, which was higher than that in the current study, and 9.6% of the respondents practiced traditional methods, which was less than that in the current study. The traditional treatment or control methods used were (50.62%) mixing chicken feed, (34.58%) adding drinking water and (14.8%) direct feeding or drinking plant extracts for chickens in the study area.
| Table 8: | Indigenous chicken health management practices in the study area | |||
| Agro-ecology | ||||||
| HL | ML | |||||
| Health management practices | N = 160 | Percentage | N=160 | Percentage | Overall (%) | p-value |
| Cause of chicken mortality? | ||||||
| Due to management | 35 | 21.87a | 30 | 18.75b | 20.278 | 0.0004 |
| Predators | 37 | 23.13a | 23 | 14.375b | 18.793 | 0.0001 |
| Disease | 72 | 45.00b | 83 | 51.875a | 48.405 | 0.0001 |
| unknown causes | 16 | 10.00b | 24 | 15.00a | 12.53 | 0.0001 |
| Most prevalent disease? | ||||||
| Fengle/newcastle | 152 | 95.00a | 147 | 91.875b | 93.285 | 0.0002 |
| Fowl pox | 8 | 5.000b | 13 | 8.125a | 6.717 | 0.0002 |
| Types of control and treatment measures? | ||||||
| Modern | 22 | 13.75a | 13 | 8.125b | 11.092 | 0.0001 |
| Traditional | 138 | 86.25b | 147 | 91.875a | 88.91 | 0.0001 |
| Way of traditional treatment or control methods | ||||||
| Mix with chicken feed | 74 | 53.62a | 70 | 47.62b | 50.621 | 0.0001 |
| Add with drinking water | 41 | 29.71b | 58 | 39.46a | 34.583 | 0.0001 |
| Direct feeding/drinking | 23 | 16.67a | 19 | 12.93b | 14.796 | 0.0001 |
| Do you separate the sick chicken? | ||||||
| Yes | 122 | 76.25a | 117 | 72.89b | 74.57 | 0.0002 |
| No | 38 | 23.75b | 43 | 26.875a | 25.43 | 0.0002 |
| Do you use anti-ecto parasites? | ||||||
| Yes | 32 | 20.00b | 57 | 35.625a | 27.77 | 0.0001 |
| No | 128 | 80.00a | 103 | 64.375b | 72.23 | 0.0001 |
| Have you ever treated your sick birds? | ||||||
| Yes | 142 | 88.75a | 119 | 74.375b | 81.425 | 0.0001 |
| No | 18 | 11.25b | 41 | 25.625a | 18.575 | 0.0001 |
| Do you practice annual vaccination? | ||||||
| Yes | 5 | 3.13 | 3 | 1.875 | 2.466 | 0.1298 |
| No | 155 | 96.87 | 157 | 98.125 | 97.533 | 0.1316 |
| HL: Highland, ML: Midland, N: Number of samples and a,bRow means with different subscript letters are significantly different (p<0.05) | ||||||
To avoid external parasites, 27.77% of the chicken owners used modern anti-ecto-parasite agents on chicken feathers and perch (such as diazinon solution) and traditionally used plant leaves such as Eucalyptus, locally known as “nech bahir zaf”, and Croton macrostachyus locally called “bisana” to avoid the chicken lice “kinkin”, which is transmitted from chicken to chicken and other animals, but 72.23% did not use any anti-ecto-parasite agents for their indigenous chickens. The number of chicken owners who used anti-ecto parasite agents was significantly (p<0.05) greater in the midland agro ecology than in the highland agro ecology. This might be due to differences in the availability of veterinary clinics, medical plants, management practices, and awareness of farmers’ differences between agroecology and agroecology; even farmers’ practices might be different.
There were significantly more chicken owners who separated sick chickens from healthy flocks in the highland (p<0.05) than in the midland agroecology. The variation might be due to differences in the health management practices of chicken owners in the study area (Table 8). The inability to separate sick chicken from healthy chicken flocks might be due to low attention given to indigenous chicken and discouragement of diseased chicken survival.
Traditional disease treatment and control measures in the study area: Table 9 outlines traditional poultry disease control measures used in highland (HL) and midland (ML) agroecologies. Garlic onion is the most preferred method in both zones with the highest overall index (0.257), followed by lemon (0.240). Salt with pepper solution (0.177) and ginger with garlic onion (0.175) are moderately preferred. Red onion ranks lowest (0.151), though it is still widely used. Preferences show consistency across regions with slight variations in ranking.
| Table 9: | Traditional disease control and treatment measures used in the study area | |||
| Agro ecology | |||||||||||
| HL (N = 138) | ML (N = 147) | ||||||||||
| Traditional control measures | R1 | R2 | R3 | R4 | Indices | R1 | R2 | R3 | R4 | Indices | Overal
lIndices |
| Garlic onion | 80 | 58 | 0 | 0 | 0.264 | 68 | 47 | 27 | 5 | 0.251 | 0.257 |
| Lemon | 56 | 66 | 9 | 7 | 0.239 | 42 | 85 | 12 | 8 | 0.242 | 0.24 |
| Red onion | 13 | 30 | 38 | 57 | 0.147 | 17 | 27 | 43 | 60 | 0.155 | 0.151 |
| Salt with pepper solution | 8 | 42 | 70 | 28 | 0.174 | 16 | 24 | 64 | 43 | 0.179 | 0.177 |
| Ginger with garlic onion | 22 | 32 | 63 | 21 | 0.176 | 18 | 31 | 63 | 35 | 0.173 | 0.175 |
| Sum | 179 | 228 | 180 | 113 | 1 | 161 | 214 | 209 | 151 | 1 | 1 |
| R1-R4: Rank 1-4, HL: Highland, ML: Midland and N: Sample size | |||||||||||
The number of sick chickens in the highlands was significantly (p<0.05) greater than that in the midland agro ecology in the study area, which might be due to the variation of environmental temperature and husbandry practices between the two agro ecologies (Table 10). Chicken owners in the study area used traditional disease treatment medicinal plants for treating sick chickens administrating mixing with water and supplementary chicken feed resources in the study area were garlic onion “Allium sativum”, lemon “Citrus limon”, salt with pepper “Capsicum annuum” solution, ginger “Zingiber officinale” together with garlic onion, and onion “Allium cepa”, which ranked first, second, third, fourth, and fifth, respectively (Table 9). This finding was in line with the findings of Duguma15, which reported that sick birds were treated traditionally by the administration of lemon, the alcoholic drink “Areke”, which was supplemented with feed and water in urban and peri-urban areas of Guder town in the Oromia Region, and Tilahun19, who reported traditional disease control medicines such as the red pepper “Capsicum annuum”, the lemon “Citrus limon”, the Simfa/feto “wormwood Artemisia absinthian” and the garlic onion “Allium sativum” to prevent chicken disease and treat sick chickens by adding regular feeds and providing them to chickens in the Jimma Zone of Southwest Ethiopia.
Farmers acquire indigenous chickens mainly through both hatching and purchasing, which hold the highest overall index (0.324), followed by purchasing from local markets (0.266). Home hatching is moderately practiced (0.232), while receiving chickens as gifts is the least common source (0.189). For improving local chicken breeds, selection is the dominant method in both highland and midland zones, with an overall index of 0.553, whereas line breeding is less frequently used (0.447). Regarding culling, the primary reason is sickness or disease (0.307), followed by old age (0.278) and poor productivity (0.215). Chickens with physical defects are the least likely to be culled, with an index of 0.200 in Table 10.
Sources and improvement practices of indigenous chickens: The study result revealed that chicken owners select indigenous chicken as a parent from different sources with in different selection criteria as shown in Table 11 and households practice indigenous chicken improvement practices in the study area. The primary source of indigenous chicken used as a parent was hatching chicks at home with broody hens and purchasing from local markets or nearby markets was the primary source and ranked first. Purchasing from local markets ranked second, hatching chicks from best chicken parents at home ranked third, and chickens obtained as a gift from parents were ranked fourth as sources of indigenous chicken as a parent in the study area. With respect to improvements in the productivity of local chicken breeds, the best cocks and hens were the first to be selected from the present flock, and line breeding or mating of the best related parents was the second most common method used by the sampled farmers to improve their local chickens in the study area (Table 10). Culling of underproductive chickens was a common practice in the study area. Chicken owners sell or slaughter cockerels or pullets at a young age in order to eliminate unwanted chickens from the existing flock. The current finding was consistent with that of Moges et al.20 who reported that, selling and slaughtering of chicken were popular culling practices for unproductive chickens. Unproductive chickens were culled due to sickness, old age, defected chicken and poor productive performance of indigenous chicken ranked 1st, 2nd, 3rd and 4th culling reasons respectively in the study (Table 10).
| Table 10: | Selection and culling practices for indigenous chicken in the study area | |||
| Agro ecology | |||||||||||
| HL (N = 160) | ML (N = 160) | ||||||||||
| Source of indigenous chicken | R1 | R2 | R3 | R4 | Indices | R1 | R2 | R3 | R4 | Indices | Overall Indices |
| Purchasing from the local market | 44 | 58 | 28 | 30 | 0.269 | 38 | 64 | 37 | 21 | 0.263 | 0.266 |
| Hatching from home | 33 | 38 | 65 | 24 | 0.246 | 25 | 33 | 61 | 41 | 0.217 | 0.232 |
| Hatching and purchasing | 103 | 27 | 30 | 0 | 0.341 | 83 | 40 | 24 | 13 | 0.307 | 0.324 |
| Gift from parents | 15 | 19 | 55 | 71 | 0.184 | 21 | 24 | 53 | 62 | 0.194 | 0.189 |
| Sum | 187 | 137 | 172 | 120 | 1 | 175 | 161 | 175 | 137 | 1 | 1 |
| How do you improve your local chicken? | |||||||||||
| line breeding | 23 | 137 | 0 | 0 | 0.448 | 20 | 140 | 0 | 0 | 0.446 | 0.447 |
| Selection | 140 | 20 | 0 | 0 | 0.552 | 142 | 18 | 0 | 0 | 0.554 | 0.553 |
| Sum | 163 | 157 | 0 | 0 | 1 | 162 | 158 | 0 | 0 | 1 | 1 |
| Reasons for culling of chicken | |||||||||||
| Sickness/disease | 64 | 51 | 32 | 13 | 0.314 | 62 | 42 | 34 | 22 | 0.299 | 0.307 |
| Old aged chicken | 45 | 60 | 36 | 19 | 0.284 | 34 | 61 | 38 | 27 | 0.272 | 0.278 |
| Defected chicken | 20 | 33 | 43 | 64 | 0.2 | 15 | 29 | 49 | 67 | 0.201 | 0.2 |
| Poorly productive chicken | 15 | 29 | 76 | 40 | 0.202 | 19 | 32 | 72 | 37 | 0.228 | 0.215 |
| Sum | 144 | 173 | 187 | 136 | 1 | 130 | 164 | 193 | 153 | 1 | 1 |
| R1-R4: Rank 1 up to 4, HL: Highland; ML: Midland and N: Sample size | |||||||||||
Culling and selection practices for indigenous chickens: The chicken owners in the study area practiced culling indigenous chickens to improve their indigenous chicken productivity. There were significantly more culling practices involving indigenous chicken in the midlands (p<0.05) than in the highlands. The selection of indigenous chicken based on body weight was significantly (p<0.05) greater in the midland area, while the selection of chicken based on chicken plumage color was significantly (p<0.05) greater in the highland agro ecology in the study area (Table 11). This might be due to differences in the husbandry practices of chicken owners and their awareness of and preferences for chicken owners in the study area. Most of the respondents (68.13%) purposely cull cocks, and 31.87% cull cocks for any reason. After culling, 72.5% of the chicken owners sold at the local and district level markets, and 27.5% were slaughtered and consumed at home at the time of holidays or at any time when the chicken matured (Table 11). The reasons for indigenous chicken culling were sickness or diseased chicken ranking first, old age of chicken ranking second, poor productive performance (hens having low egg production, unable to brood properly and hens that were aggressive or difficult during management and cocks having low growth performance and having cannibalism behavior were culled at the third level), and defective chicken whose legs, eyes, wings or any other defected chicken were culled and ranked at the fourth level in the study area (Table 10). The results of the present study were consistent with the report of Tilahun et al.19. The reported selection criteria for cocks were body weight, comb type and plumage colour (1st, 2nd and 3rd), and body weight was ranked first in the highland, midland and lowland agro-ecologies, while female chicken body weight (59.7%), finger accommodation between the pelvic bones (25.2%) and plumage color (8.6%) were used in Jimma Zone of Southwest Ethiopia, and Moges et al.11,20 reported that, 50% of the respondents used the selection criteria of body weight, plumage color and hatching history of chickens in Gomma District. Gulilat et al.21 also reported nearly comparable reports on culling practices for chickens and reported that most chicken owners practice chicken culling, based on poor productivity, poor productivity and sick birds or due to different defects or poor productivity, old age and sickness (47.3, 22.9 and 17.7%, respectively) because of home consumption (64.9%), home consumption and selling (24.7%) and selling (10.4%) in the Arbegona Wereda of the Sidama Region.
Major constraints on indigenous chicken production: The major constraints of indigenous chicken production in the study area were disease, predator, supplementary feed resources, house and housing for indigenous chicken, and marketing constraint (ranked first, second, third, fourth, and fifth) levels, respectively (Table 12).
| Table 11: | Culling and selection practices for indigenous chicken in the study area | |||
| Agro ecology | ||||||
| HL | ML | |||||
| Culling and selection practices | N = 160 | Percentage | N = 160 | Percentage | Overall (%) | p-value |
| Culling practice of chicken | ||||||
| Yes | 137 | 85.62b | 154 | 96.25a | 90.94 | 0.0001 |
| No | 23 | 14.38a | 6 | 3.75b | 9.06 | 0.0001 |
| Indigenous chicken selection criteria’s | ||||||
| Body weight | 82 | 59.85b | 99 | 64.29a | 62.07 | 0.0001 |
| Plumage color | 25 | 18.25a | 22 | 14.28b | 16.27 | 0.0001 |
| Pedigree performance | 19 | 13.86 | 21 | 13.64 | 13.75 | 0.0856 |
| Comb type | 11 | 8.03 | 12 | 7.8 | 7.91 | 0.2483 |
| Do you purposely cull cocks? | ||||||
| Yes | 95 | 59.38b | 123 | 76.88a | 68.1 | 0.0001 |
| No | 65 | 40.62a | 37 | 23.13b | 31.9 | 0.0001 |
| What is the fate of culled chicken? | ||||||
| Consumption | 40 | 25.00b | 48 | 30.00a | 27.5 | 0.0001 |
| Sold | 120 | 75.00a | 112 | 70.00b | 72.5 | 0.0001 |
| HL: Highland; ML: Midland, N: Number of samples and a,bRow means with different subscript letters are significantly different (p<0.05) | ||||||
| Table 12: | Major constraints on indigenous chicken production in the study area | |||
| Agro ecology | |||||||||||||
| HL (N = 160) | ML (N = 160) | ||||||||||||
| Major constraints | R1 | R2 | R3 | R4 | R5 | Indices | R1 | R2 | R3 | R4 | R5 | Indices | Overall Indices |
| Diseases | 74 | 49 | 37 | 0 | 0 | 0.258 | 68 | 43 | 39 | 10 | 0 | 0.247 | 0.252 |
| Shortage of feed | 26 | 46 | 55 | 21 | 12 | 0.203 | 29 | 40 | 62 | 20 | 9 | 0.205 | 0.204 |
| Predators attack | 38 | 61 | 27 | 18 | 16 | 0.216 | 36 | 69 | 33 | 16 | 6 | 0.225 | 0.221 |
| Lack of housing | 21 | 25 | 32 | 35 | 47 | 0.159 | 21 | 30 | 34 | 49 | 26 | 0.171 | 0.165 |
| Marketing | 12 | 31 | 39 | 48 | 30 | 0.164 | 15 | 22 | 35 | 43 | 45 | 0.152 | 0.158 |
| Sum | 171 | 212 | 190 | 122 | 105 | 1 | 169 | 204 | 203 | 138 | 86 | 1 | 1 |
| R1-R5: Rank 1-5, HL: Highland, ML: Midland and N: Sample size | |||||||||||||
The major constraints affecting indigenous chicken production in both highland (HL) and midland (ML) agro-ecologies are primarily disease outbreaks, with the highest overall index of 0.252. This is followed by predator attacks (0.221) and shortage of feed (0.204), which also pose significant challenges. Lack of housing (0.165) and poor marketing (0.158) are less critical but still relevant. While the ranking of constraints is consistent across both zones, the intensity of each varies slightly, with diseases and predators being the most pressing issues overall.
These results were in line with the findings of Mamo et al.22 from Northern Gondar, who reported that diseases (first), predators (second), shortages of supplementary feeds (third), poultry housing problems (fourth) and lack of veterinary health services (fifth) were the most important constraints of indigenous chicken production systems in urban areas, and Markos et al.12 reported that disease and predators were the first and second chicken production bottlenecks in all agro-ecological zones of the Western Zone of Tigray, Northern Ethiopia. The current findings were also consistent with the report of Dugma15, who reported that the major limitations were disease (0.28), feed (0.19), and predators (0.144) (ranked first, second and third, respectively) in the urban and peri-urban areas of Guder town in the Oromia Region, Ethiopia. Mengesha et al.23 also reported that disease prevalence, predators, market problems, lack of water, lack of proper health care, and low feeding and extension services, combined with veterinary services, were the major bottlenecks for chicken production under farmer management conditions in Jamma District, South Wollo of Ethiopia.
Predator constraints: According to the information of the sampled households in all the study areas, there was predator prevalence, which was the second constraint, next to disease. The major indigenous chicken predators were wild cats locally called “Shelemetmate” or “Sholelite” (54.69%), eagle/Hawk locally called “Cille” (15.63%), cats locally called “Muladen” (11.25%), “Aner” or “Mikmike” (8.44%), Rats (5.3%) and foxes (4.69%). “Shelemetmat”, Hawk or “Cille”, Fox and Rats were significantly (P<0.05) more common in the midland, but “Aner” and “Cats” were significantly (p<0.05) more common in the highland agro ecology. Most predators attack chickens in the rainy season or summer season (57.2%), both in the winter and summer seasons (27.5%), and in the winter season (15.3%). In the summer season, the most common chicken predators were “Shelemetmate” or “Sholelite” and “Cats” or “Muladen”; in the winter and summer seasons, the most common chicken predators were fox, hawk, “Aner”, rats and Eagle or “Cille”, which attack chickens both in the summer and winter seasons. As mentioned (Table 13), 58.13% of the young chickens attacked more than 41.87% of the adult chickens in the study area. Shelemetmate, Aner, and Fox attack adult chickens; however, Hawk, Cats, and Rats attack young chicks. The rats not only attacked the young chicks but also damaged/brooded the chicken eggs in the nesting area by brooding and laying eggs and drinking the internal egg contents in the study area, as indicated by the respondents. The current finding was in line with the report of Yemane et al.24, who reported that most of the respondents ranked predators (hawks, foxes, and wild cats) as the main chicken production constraints in the Halaba Zone of Southern Ethiopia. Similar findings were reported by Marko et al.12, who reported that birds of prey (blackkite, Milvus migrants locally known as “Shilla” and Augur buzzard, Bueteo rufofuscus, locally known as “Chilfit”, Abyssinian Genet, Genetta Abyssinia locally known as “Silhlohot”), Abyssinian cats (locally called “Mutsu”), domestic cats, dogs, snakes and rats (locally called” Anchiwa Eimer”) were common predators that cause death of indigenous chickens in the Western Zone of Tigray, Northern Ethiopia. Bekele and Shigute25 reported that, Predators (snakes, rats, dogs, cats, and foxes) cause the death of chickens, especially young chicks, within the southern neighbourhood of Ethiopia.
Indigenous chicken feed shortage: The majority (94.38%) of the respondents responded that there was a lack of indigenous chicken supplementary feed, which affected the production and productivity of indigenous chicken in addition to disease and predators and was significantly (p<0.05) greater in the highland agro ecology. There was a lack of supplementary chicken feed scarcity from September to March, which was significantly (p<0.05) greater in the midland, and from April to August, which was significantly (p<0.05) greater in the highland agro ecology. The causes of indigenous chicken feed scarcity were a lack of attention to or a lack of awareness of how to supplement local chicken feed. The price of chicken feed was significantly (p<0.05) greater in the midland agro ecology, but the lack of available feed resources was significantly (p<0.05) greater in the highland agro ecology (Table 13). This finding was nearly in agreement with the report of Ahiwe et al.26, who reported that chicken production is similarly inhibited by reduced contact with goods, markets, and services, poor institutional commitment, and a lack of skilled knowledge.
Housing constraints of indigenous chickens: Housing constraints were another challenge for indigenous chickens in the study area. The major reasons for the absence of chicken housing were a lack of attention because the small flock size and lack of human power available to construct chicken houses were significantly (p<0.05) greater in the highland; however, the lack of materials available to construct chicken houses was significantly (p<0.05) greater in the midland agro ecology (Table 13). The variation might be due to the agro ecology and the awareness of households in the study area. These results are in agreement with those of Melak et al.14, who reported that small flock size per household (34.6%), a lack of construction materials (25%), a lack of knowledge (19.6%), a risk of predators (12.1%) and a shortage of labor and time (5.4%) were some of the reasons that farmers did not construct a separate house for chickens in Fogera District, and they also reported a lack of attention to indigenous chickens (34.6%), a lack of construction materials (25%), a lack of knowledge and awareness (19.6%), a lack of predators (12.1%) and a shortage of labour and time (5.4%) in the Bure District, North West Ethiopia.
| Table 13: | Constraints and possibilities for indigenous chicken production in the study area | |||
| Agro ecology | ||||||
| HL | ML | |||||
| Constraints | N = 160 | Percentage | N = 160 | Percentage | Overall | p-value |
| Predator problem? | ||||||
| Yes | 160 | 100 | 160 | 100 | 100 | 1 |
| Major predators? | ||||||
| “Shelemetmate” | 85 | 53.125b | 90 | 56.25a | 54.69 | 0.0001 |
| Eagle/Hawk | 16 | 10b | 34 | 21.25a | 15.63 | 0.0001 |
| Fox | 3 | 1.875b | 12 | 7.5a | 4.688 | 0.0001 |
| “Aner” | 27 | 16.875a | 0 | 0.00b | 8.438 | 0.0001 |
| Cats | 22 | 13.75a | 14 | 8.75b | 11.25 | 0.0001 |
| Rats | 7 | 4.375b | 10 | 6.25a | 5.313 | 0.0051 |
| At which season is the problem worst? | ||||||
| Summer/kiremt | 92 | 57.5 | 91 | 56.88 | 57.19 | 0.3353 |
| Winter/bega | 17 | 10.625b | 32 | 20.00a | 15.31 | 0.0001 |
| Summer and winter | 51 | 31.875a | 37 | 23.12b | 27.5 | 0.0001 |
| Which age groups attacked more? | ||||||
| Young chicken | 91 | 56.875b | 95 | 59.37a | 58.13 | 0.0003 |
| Adult chicken | 69 | 43.125a | 65 | 40.63b | 41.88 | 0.0002 |
| Is there lack of feed for chicken? | ||||||
| Yes | 155 | 96.875a | 147 | 91.88b | 94.38 | 0.0001 |
| No | 5 | 3.125b | 13 | 8.12a | 5.625 | 0.0001 |
| Causes of fed scarcity? | ||||||
| Lack of attention | 73 | 45.625b | 78 | 48.75a | 47.19 | 0.0001 |
| Lack of available feeds | 33 | 20.625a | 23 | 14.37b | 17.5 | 0.0001 |
| High price of feeds | 54 | 33.75b | 59 | 36.88a | 35.31 | 0.0001 |
| Season of the year feed scarcity is occurred? | ||||||
| September to December | 15 | 9.375b | 26 | 16.25a | 12.81 | 0.0001 |
| January to March | 48 | 30b | 56 | 35a | 32.5 | 0.0001 |
| April to August | 97 | 60.625a | 78 | 48.75b | 54.69 | 0.0001 |
| Reasons lack of proper housing? | ||||||
| Lack of attention | 76 | 47.5a | 66 | 41.25b | 44.38 | 0.0001 |
| Due to small flock size | 32 | 20a | 17 | 10.63b | 15.31 | 0.0001 |
| Lack of materials to construct | 22 | 13.75b | 72 | 45.00a | 29.38 | 0.0001 |
| Shortage of labor | 30 | 18.75a | 5 | 3.125b | 10.94 | 0.0001 |
| Major constraints in chicken and eggs marketing? | ||||||
| Disease transmission and stress | 66 | 41.25a | 57 | 35.63b | 38.44 | 0.0001 |
| Low market price | 33 | 20.625b | 44 | 27.50a | 24.06 | 0.0001 |
| Market distance | 44 | 27.5a | 30 | 18.75b | 23.13 | 0.0001 |
| Open market without shade | 11 | 6.875b | 20 | 12.5a | 9.688 | 0.0001 |
| Transport problem | 6 | 3.75b | 9 | 5.625a | 4.688 | 0.0051 |
| Major possibilities of indigenous chicken production? | ||||||
| Availability of road access | 45 | 28.125b | 59 | 36.88a | 32.5 | 0.0001 |
| Availability of land | 36 | 22.50b | 48 | 30.00a | 26.25 | 0.0002 |
| Availability of water access | 54 | 33.75a | 10 | 6.25b | 20 | 0.0001 |
| Man power/labor | 12 | 7.50b | 24 | 15.00a | 11.25 | 0.0002 |
| Market demand | 13 | 8.125b | 19 | 11.88a | 10 | 0.0182 |
| HL: Highland, ML: Midland, N: Sample size and a,bRow means significantly different at p<0.05 | ||||||
Marketing constraints of live chicken and egg marketing: The major constraints of live indigenous chicken and egg marketing were disease transmission and stress in the indigenous chicken, and long market distances were significantly (p<0.05) greater in the highland, while low local market prices, open markets without shade and transportation problems were significantly (p<0.05) greater in the midland agro ecology in the study area (Table 13). The variation might be due to the agroecological effect on market constraints in the study area. The current study consistent with the report of Moges et al.20, who reported that, seasonal fluctuations in the prices of chicken and eggs, a low supply (output) of chicken and eggs due to disease and predator attack, the existence of only a few/limited market outlets (the urban markets are located very far from residential areas for many chicken producers), a lack of chicken and egg price information, a lack of space for chicken marketing and a lack of credit and money to expand chicken production and marketing activities in urban markets.
Possibilities of indigenous chicken production: The major possibilities for indigenous chicken production in the study area were the availability of road access, the availability of land for crop production and for free-scavenging indigenous chicken, the availability of human resources to manage indigenous chicken and the market demand for live indigenous chicken and indigenous chicken eggs, which were significantly (p<0.05) greater in the midland, whereas the availability of water access for all animals and hu mans was significantly (p<0.05) greater in the highland agro ecology in the study area (Table 13). Assefa and Melesse27, reported that the production of indigenous chicken, known for its low feed costs, low area requirements, and low animal prices, fits well with the circumstances of rural homes.
CONCLUSION
The main purpose of indigenous chicken production in the study area was primarily to generate income, as well as for the consumption of eggs and meat. Most households practiced a traditional management system, which included providing a limited amount of supplementary feed. In the study area, management of indigenous chickens was predominantly carried out by women. The practices of feed supplementation, culling, and selection of indigenous chicken were more prevalent in the midland compared to the highland agro ecology. To reduce broodiness and enhance the annual egg production per hen, common local techniques included tying the chickens’ wings and relocating broody nests, and take broody hens to other locations. In the study area, the primary reasons for the mortality of indigenous chickens were management issues, attacks from predators, and diseases; however, households used traditional medicinal plants to treat sick chickens. The significant constraints in the production of indigenous chickens in the area included predator attacks, a lack of supplementary feed resources, and inadequate housing. Nevertheless, the study area possesses great potential for chicken production, such as accessible roads, available water, land for crop cultivation and free-ranging chickens, labor, and demand for live indigenous chickens and their eggs.
In the study area, households generally show minimal husbandry practices for indigenous chickens; hence, it is important for stakeholders to focus on providing technical assistance, training, and creating awareness among chicken owners to enhance the practices of indigenous chicken husbandry.
SIGNIFICANCE STATEMENT
Siltie Zone has a great potential for chicken production, even though studies about husbandry practices of indigenous chicken in the study area have been limited, and there are limited documented data on this indigenous chicken in the study area. Therefore, assessments of the husbandry practices of indigenous chickens in the study area might provide basic information for poultry professionals to identify critical entry points for improving the genetic and husbandry practices of local chickens in the study area, and this information might be used as secondary data in the study area. Major indigenous chicken husbandry practices and production constraints were identified for further improvement in the study area.
ACKNOWLEDGMENTS
The authors of this manuscript would like to acknowledge Meseret Girma (PhD), Amsalu Sisay (PhD) and Mr. Kibru Beriso for their efforts to support us in technical ways and ideas. Our friends (members of Hawasa University, College of Agriculture, Department of Animal and Range Science Lecturers, Worabe Agricultural Research Center staff members and Worabe Agricultural Research Center (WARC) are grateful for their moral and material support.
REFERENCES
- FAO, 2019. Livestock Country Review-Poultry Sector Ethiopia: FAO Animal Production and Health Livestock Country Reviews. Food and Agriculture Organization, Rome, Italy, ISBN: 9789251313398, Pages: 60.
- Abraham, H., 2024. Characterization of smallholder Irob cattle production system: Contributions to develop a breeding program. Trop. Anim. Health Prod., 56.
- Gebremariam, B. and F. Girma, 2019. Review work on body weight and egg production performance of chickens in Ethiopia. J. Biol. Agric. Healthcare, 9: 16-18.
- Bekele, B., A. Melesse, W. Esatu and T. Dessie, 2022. Production performance and egg quality evaluation of indigenous chickens across different agro-ecologies of Southern Ethiopia. Vet. Integr. Sci., 20: 133-145.
- Bekele, T., M. Getahun, T. Makebo and T. Makebo, 2021. Community level project planning (CLPP) assessment report, natural resource research directorate, Worabe, Southern Ethiopia. J. Water Resour. Ocean Sci., 10: 90-104.
- Jemberu, W.T., Y. Li, W. Asfaw, D. Mayberry, P. Schrobback, J. Rushton and T.J.D. Knight-Jones, 2022. Population, biomass, and economic value of small ruminants in Ethiopia. Front. Vet. Sci., 9.
- Podder, D., B. Paul, A. Dasgupta, L. Bandyopadhyay, A. Pal and S. Roy, 2019. Community perception and risk reduction practices toward malaria and dengue: A mixed-method study in slums of Chetla, Kolkata. Indian J. Public Health, 63: 178-185.
- Musa, L.M.A., K.J. Peters and M.K.A. Ahmed, 2006. On farm characterization of Butana and Kenana cattle breed production systems in Sudan. Livestock Res. Rural Dev., 18.
- Yihun, A., 2020. Husbandry practice and reproductive performance of indigenous chicken ecotype in Awi Zone, Amhara Regional State, Ethiopia. Int. J. Appl. Agric. Sci., 6: 179-184.
- Alemayehu, A., T. Yilma, Z. Shibeshi and T. Workneh, 2015. Village chicken production systems in selected areas of Benishangul-Gumuz, Western Ethiopia. Asian J. Poult. Sci., 9: 123-132.
- Moges, F., A. Mellesse and T. Dessie, 2010. Assessment of village chicken production system and evaluation of the productive and reproductive performance of local chicken ecotype in Bure district, North West Ethiopia. Afr. J. Agric. Res., 5: 1739-1748.
- Markos, S., B. Belay and T. Dessie, 2014. On farm carcass performance evaluation of three local chicken ecotypes in Western zone of Tigray, Northern Ethiopia. J. Biol. Agric. Healthcare, 4: 154-160.
- Abubakar, M.B., A.G. Ambali and T. Tamdjo, 2007. Rural chicken production: Effects of gender on ownership and management responsibilities in some parts of Nigeria and Cameroon. Int. J. Poult. Sci., 6: 413-416.
- Melak, A., H. Kenfo, T. Aseged and A. Hailu, 2021. Production system and breeding practice of indigenous chickens in selected districts of Dawro Zone and Konta special District, Southern Ethiopia. Asian J. Agric., 5: 72-83.
- Duguma, C., 2020. Assessment of husbandry practice and egg production performance of indigenous chickens in urban and peri urban area of Guder town, Oromia Region, Ethiopia. J. Sci. Agric., 4: 124-132.
- Worku Z., A. Melesse and Y. T/Giorgis, 2012. Assessment of village chicken production system and the performance of local chicken populations in West Amhara Region of Ethiopia. J. Anim. Prod. Adv., 2: 199-207.
- Lemma, S., T. Terefe and B. Abebe, 2019. Assessment of the prevailing chicken egg storage materials and length at rural household in different agro ecology of Eastern Ethiopia. Agric. For. Fish., 8: 54-63.
- Dinka, H., R. Chala, F. Dawo, E. Bekana and S. Leta, 2010. Major constraints and health management of village poultry production in rift valley of Oromia, Ethiopia. Am. Eurasian J. Agric. Environ. Sci., 9: 529-533.
- Tilahun, M., M. Mitiku and W. Ayalew, 2022. Agroecology is affecting village chicken producers’ breeding objective in Ethiopia. Scientifica, 2022.
- Moges, F., A. Tegegne and T. Dessie, 2010. Indigenous Chicken Production and Marketing Systems in Ethiopia: Characteristics and Opportunities for Market-Oriented Development. ILRI (aka ILCA and ILRAD), Nairobi, Kenya, Pages: 55.
- Gulilat, L., F. Tegegne and S. Demeke, 2021. Hatchery and broody technologies and least cost ration practice for poultry production improvement in Ethiopia: Review. Cogent Food Agric., 7.
- Mamo, W., M. Melaku and B. Tamir, 2013. Characterization of urban poultry production system in Northern Gondar, Amhara Regional State, Ethiopia. Agric. Biol. J. N. Am., 4: 192-198.
- Mengesha, M., B. Tamir and T. Dessie, 2011. Village chicken constraints and traditional management practices in Jamma District, South Wollo, Ethiopia. J. Livest. Res. Rural Dev., 23.
- Yemane, N., B. Tamir and K. Belihu, 2013. Characterization of village chicken production performance under scavenging system in Halaba district of Southern Ethiopia. Ethiopian Vet. J., 17: 69-80.
- Bekele, B. and T. Shigute, 2019. Assessment of some breeding parameters of local chicken breeds in Hadiya Zone of Southern Region, Ethiopia. Int. J. Innovative Sci. Res. Technol., 4: 909-917.
- Ahiwe, E.U., A.A. Omede, M.B. Abdallh and P.A. Iji, 2018. Managing Dietary Energy Intake by Broiler Chickens to Reduce Production Costs and Improve Product Quality. In: Animal Husbandry and Nutrition, Yucel B. and T. Taskin (Eds.), IntechOpen, London, United Kingdom, ISBN: 978-1-83881-445-8, pp: 115-145.
- Assefa, H. and A. Melesse, 2018. Morphological and morphometric characterization of indigenous chicken populations in Sheka Zone, South Western Ethiopia. Poult. Fish. Wildl. Sci., 6.
How to Cite this paper?
APA-7 Style
Aman,
Y.K., Reda,
K.B. (2025). Husbandry Practices, Constraints, and Opportunities in Indigenous Chicken Production in the Siltie Zone, Central Ethiopia. Trends in Agricultural Sciences, 4(3), 200-218. https://doi.org/10.17311/tas.2025.200.218
ACS Style
Aman,
Y.K.; Reda,
K.B. Husbandry Practices, Constraints, and Opportunities in Indigenous Chicken Production in the Siltie Zone, Central Ethiopia. Trends Agric. Sci 2025, 4, 200-218. https://doi.org/10.17311/tas.2025.200.218
AMA Style
Aman
YK, Reda
KB. Husbandry Practices, Constraints, and Opportunities in Indigenous Chicken Production in the Siltie Zone, Central Ethiopia. Trends in Agricultural Sciences. 2025; 4(3): 200-218. https://doi.org/10.17311/tas.2025.200.218
Chicago/Turabian Style
Aman, Yesuf, Kedalla, and Kefyalew Berihun Reda.
2025. "Husbandry Practices, Constraints, and Opportunities in Indigenous Chicken Production in the Siltie Zone, Central Ethiopia" Trends in Agricultural Sciences 4, no. 3: 200-218. https://doi.org/10.17311/tas.2025.200.218

This work is licensed under a Creative Commons Attribution 4.0 International License.