Exploring Salinity Tolerance in Advanced Rice Lines: Agronomic and Molecular Characterization for Breeding Advances
-
S.E.M. Sedeek
Rice Research Section, Field Crops Research Institute, Agriculture Research Center, Egypt
Mervat, M.A. OsmanRice Research Section, Field Crops Research Institute, Agriculture Research Center, Egypt
M. AbdelrahmanRice Research Section, Field Crops Research Institute, Agriculture Research Center, Egypt
M.M. AbdelhamedRice Research Section, Field Crops Research Institute, Agriculture Research Center, Egypt
G.B. Anis
Rice Research Section, Field Crops Research Institute, Agriculture Research Center, Egypt
| Received 25 Mar, 2025 |
Accepted 28 Jun, 2025 |
Published 30 Sep, 2025 |
Background and Objective: Salinity is a major constraint for sustainable rice production, and developing new rice varieties with inherent tolerance against this major abiotic stress will help achieve a sustained increase in rice production under unfavorable conditions. The present study was conducted to identify which of the rice promising lines possess the genetic capacity to withstand salt stress as compared to their tolerant parent. Materials and Methods: These experiments were carried out in a randomized complete design with three replications to test 14 rice genotypes under normal and saline stress at Sakha Research Station, Egypt, as normal soil, and El-Sirw, Damietta, as saline soil, respectively, during the 2022 and 2023 summer seasons. Further molecular analysis was applied. Results: The data obtained revealed a big variation among the tested rice lines as compared with their parents for the studied agronomical characteristics and molecular markers. The genotypes, including the elite lines and their parents, and all plant characteristics, were affected significantly and negatively by salinity stress. The rice genotype GZ12103-3-4-6-4 recorded the highest grain yield under normal soil at Sakha (11.23 ton/ha), while the genotype GZ12103-3-11-14-24-2 recorded the lowest grain yield under the same conditions. The GZ12103-3-4-6-4, GZ12103-3-4-6-1, and GZ12103-3-4-5-2 were the highest yielding genotypes under saline soil conditions (5.53 and 5.50 ton/ha) compared with their parents, GZ9461-4-2-3-1 and GZ9399-4-1-1-3-2-2 (2.80 and 3.63 ton/ha). The phenotypic coefficient of variability was higher than the genotypic coefficient of variability for all plant characteristics, indicating the environmental effect on the expression of these characters. While the biggest portion of PCV (%) was contributed by the genotypic component, less by the environmental component. Conclusion: Cluster analysis based molecular results revealed the separation of those three high-yielding genotypes together with their salinity tolerance parent GZ9399-4-1-1-3-2-2. Current results shed light on the incorporation of those advanced, promising lines in the breeding program for salinity tolerance.
| Copyright © 2025 Sedeek et al. This is an open-access article distributed under the Creative Commons Attribution License, which permits unrestricted use, distribution, and reproduction in any medium, provided the original work is properly cited. |
INTRODUCTION
Rice (Oryza sativa L.) is a staple for more than 3.5 billion people to provide 50-80% daily calorie intake1. Among various abiotic stresses, salinity is the second most devastating constraint to rice production after drought. Approximately 800 million ha of agricultural land worldwide are affected by salts, which cause losses worth around 12 billion dollars in agricultural production2,3. Rice is one of the most salt-sensitive crops to salinity stress, with substantial reductions in yield under saline conditions4.
Grain yield in rice is strongly influenced by factors affecting plant development and its responses to salinity stress. Salinity poses a major challenge for increasing rice production not only in Egypt but also worldwide5. Similar to other environmental stresses, salinity, like many others, has adverse effects on crop yield. The sensitivity of rice to soil salinity varies across the different growth stages6. Recent studies by Aref and Rad7indicated that phenotypic variance exceeded genotypic variance for all studied traits. Broad-sense heritability ranged from 0.35 to 0.99 for all traits in both seasons8. Johnson et al.9 observed significant variation among rice genotypes for all studied characters, signifying the broader sense of genetic variability for selection. They also reported high phenotypic coefficient of variation (PCV) and genotypic coefficient of variation (GCV) for yield components such as the number of grains/panicle, panicles/hill, and tillers/hill. All of the characters had higher heritability (greater than 60%) and higher genetic advance (greater than 20%). The success of a rice breeding program depends greatly on selecting the right parents for hybridization and identifying the best-performing lines adapted to saline stress.
Molecular marker technology offers a powerful tool for identifying genetic diversity at the DNA level among different rice genotypes. The advantage of molecular markers is their speed, efficiency, and lack of being affected by environmental conditions. It has contributed to the varietal identification and is recommended for varietal intellectual property rights. It supports breeders in identifying genomic regions and for marker-assisted selection10. Among other markers, simple sequence repeats (SSRs) are highly reliable, providing precise loci and are widely used for diversity analysis. SSR markers are successfully used for discriminating near-isogenic lines in rice11. In the current study, several sister lines with high-yielding performance under normal conditions were evaluated for salinity tolerance. The aim was to identify which of these lines possesses the genetic capacity to withstand salt stress as compared to their tolerant parent.
MATERIALS AND METHODS
Study area: The duration of the study was from 2022 and 2023, as mentioned.
Study design: Two field experiments were conducted using a randomized complete design with three replications at the experimental farm of Sakha Agricultural Research Station, Egypt, Kafr El-Sheikh, as normal soil, and at El-Sirw (Damietta) as saline soil, along with molecular analysis at the biotechnology laboratory of the rice research and training center. The experiments were carried out during the 2022 and 2023 summer seasons to evaluate the performance of the promising rice genotypes and their parents under normal and saline conditions.
The pedigree of these rice genotypes and their parents utilized in this investigation are shown in Table 1.
The studied characteristics include duration (days), plant height (cm), number of panicles/hill, panicle length (cm), number of filled grains/panicle, 1000-grain weight (g), and grain yield (ton/ha) were measured according to the standard evaluation system of rice12. Recommended cultural practices were followed for the two conditions.
Statistical analysis: Analysis of Variance (ANOVA) was performed for each season13. Error variances from separate analysis of the data were tested for homogeneity according to Bartlett’s test14. The phenotypic (PCV %) and genotypic (GCV %) coefficient of variability were estimated15. The expected genetic advance from selection (g) for the studied traits, as well as the phenotypic correlations between any pairs of traits, were calculated16. The value of GCV (%) and PCV (%) was estimated17. Heritability in the broad sense was calculated18 .
| Table 1: | Pedigree and the subtypes of the promising rice lines and their parents | |||
| No. | Genotype | Pedigree | Type |
| 1 | GZ6296-12-1-1-2-1-1 | Ac1225/Hua Lien Yu202 | Indica-Japonica |
| 2 | GZ12089-3-11-2-1 | GZ6296-12-1-1-2-1-1/Yun gen 135 | Indica-Japonica |
| 3 | Yun gen 135 | Introduced | Indica-Japonica |
| 4 | GZ9461-4-2-3-1 | Daey2Beyo/GZ6296-12-1-4-1-1 | Indica-Japonica |
| 5 | GZ12103-3-4-5-1 | GZ9461-4-2-3-1/GZ9399-4-1-1-3-2-2 | Indica-Japonica |
| 6 | GZ12103-3-4-5-2 | GZ9461-4-2-3-1/GZ9399-4-1-1-3-2-2 | Indica-Japonica |
| 7 | GZ12103-3-4-5-5 | GZ9461-4-2-3-1/GZ9399-4-1-1-3-2-2 | Indica-Japonica |
| 8 | GZ12103-3-4-6-1 | GZ9461-4-2-3-1/GZ9399-4-1-1-3-2-2 | Indica-Japonica |
| 9 | GZ12103-3-4-6-4 | GZ9461-4-2-3-1/GZ9399-4-1-1-3-2-2 | Indica-Japonica |
| 10 | GZ12103-3-4-6-7 | GZ9461-4-2-3-1/GZ9399-4-1-1-3-2-2 | Indica-Japonica |
| 11 | GZ12103-3-5-10-2 | GZ9461-4-2-3-1/GZ9399-4-1-1-3-2-2 | Indica-Japonica |
| 12 | GZ12103-11-14-21-1 | GZ9461-4-2-3-1/GZ9399-4-1-1-3-2-2 | Indica-Japonica |
| 13 | GZ12103-3-11-14-24-2 | GZ9461-4-2-3-1/GZ9399-4-1-1-3-2-2 | Indica-Japonica |
| 14 | GZ9399-4-1-1-3-2-2 | Giza 178/IR65844 | Indica-Japonica |
| Table 2: | Marker name, chromosome number, size, and sequences of SSR markers used in this study | |||
| Marker | Chr. | Primer sequence (5'→3') |
| ISSR2 | 5'→AGAGAGAGAGAGAGAGC→3' | |
| ISSR3 | 5'→GAGAGAGAGAGAGAGAC→3' | |
| ISSR5 | 5'→AGAGAGAGAGAGAGAGG→3' | |
| RM164 | 5 | F→TCTTGCCCGTCACTGCAGATATCC |
| R→GCAGCCCTAATGCTACAATTCTTC | ||
| RM410 | 9 | F→GCTCAACGTTTCGTTCCTG |
| R→GAAGATGCGTAAAGTGAACGG | ||
| RM566 | 9 | F→ACCCAACTACGATCAGCTCG |
| R→CTCCAGGAACACGCTCTTTC | ||
| RM3894 | 3 | F→TATGCTCTCTCCTTCAGGCC |
| R→CTTACCAACTCCGCACTTGC |
Molecular diversity analysis of advanced rice lines as compared with their parents
Genomic DNA isolation: Genomic DNA was extracted from the 14 genotypes listed in Table 1 at the biotechnology laboratory of Rice Research and Training Center, Sakha, Egypt. Seedlings 14 days old were crushed in liquid nitrogen the extraction was conducted following the CTAB method19. The quantity and quality of the samples’ DNA were manipulated based on the diluted uncut lambda phage DNA as a size standard using 0.8% agarose gel electrophoresis. The concentration of DNA was adjusted to approximately 20 ng/μL for the PCR reaction.
PCR amplification and electrophoresis: A set of molecular markers consisting of 4 ISSR and 4 SSR markers was used for the diversity analysis. Primer names and sequences are provided in Table 2. The PCR amplification reactions were conducted using 2XGoTaq Green Master Mix (Promega, USA) as per the manufacturer’s instructions. The PCR reaction mixture was first denatured for 5 min at 94°C, followed by 35 cycles of denaturation for 1 min at 94°C, annealing at 2°C for 30 sec, and elongation at 72°C for 1 min. A final extension was done at 72°C for 10 min. The PCR products were run on a 3% agarose gel containing ethidium bromide for 60 volts (2.5V/cm) in 1X TAE (pH 8.0). A DNA ladder (100 bp) was used for the determination of amplicon sizes. Gels were analyzed using a Biometra gel-documentation system (BioDoc, Biometra, Germany). Amplified bands were scored as present (1) or absent (0) for each genotype and primer pair.
Genetic similarity coefficients based on the molecular data were used to construct a hierarchical dendrogram via the unweighted pair group method with arithmetic average (UPGMA), sequential agglomerative hierarchical nested (SHAN) clustering. The statistical package is available in R version 4.2.3. (R Core Team, 2010) was used to conduct multivariate analysis.
RESULTS AND DISCUSSION
Mean performance of rice genotypes under normal and saline conditions
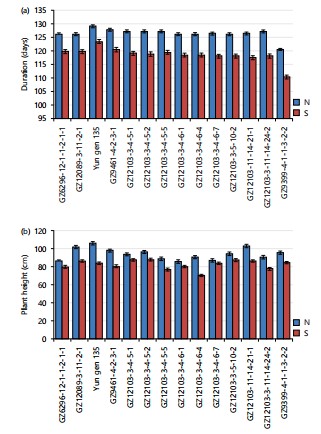
Newly developed lines have better vegetative characteristics: To understand the performance of the newly developed elite lines, the genotypes were grown under both non-salt and salt-affected locations. The results of vegetative characters presented in Fig. 1a-b indicate that the performance of the rice genotypes, including the newly developed elite lines and their parents, was significantly and negatively affected by salinity stress. The reduction in these traits varied among the genotypes due to the genetic background and the inherent level of tolerance for each genotype.
For plant duration, all the rice genotypes matured earlier under saline conditions compared to normal soil. Among the elite genotypes, GZ9399-4-1-1-3-2-2 exhibited the shortest duration under both normal and saline soil, with reordered values of 120.33 and 110.33 days. This reduction in growth duration under saline stress is consistent with previous findings that salt stress accelerates plant maturation by inhibiting normal metabolic processes20.
Regarding plant height, all genotypes showed a significant reduction under salinity stress compared to their performance in normal soil. The reduction in the plant height under saline soil may be attributed to the reduction in cell turgor, which limits cell enlargement, resulting in decreased shoot enlargement and plant growth21. Aref and Rad7 also observed a significant impact of salinity stress leading to stunted plant growth. Salinity stress reduces cell division, size, and plant height, especially was the extent of water shortage stress.
|
|
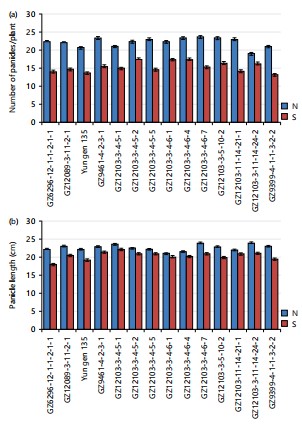
For several panicles per hill, the rice genotypes differed significantly, largely due to the genetic variability and their respective salinity tolerance level. The highest number of panicles per hill was observed under normal soil for all the genotypes compared to saline soil. Specifically, GZ12089-3-11-2-1 produced more panicles per hill than its parent Yun gen 135 under both normal and saline soil, Fig. 2. The GZ12103-3-4-6-4, GZ12103-3-4-5-2, GZ12103-3-4-6-1 recorded the highest panicle number per hill with no significant difference from their parent GZ9461-4-2-3-1, but significantly higher than their other parent GZ9399-4-1-1-3-2-2. Similarly, these same genotypes were the best under saline soil compared to their parents, GZ9461-4-2-3-1 and GZ9399-4-1-1-3-2-2.
The panicle length was significantly reduced under saline soil conditions compared to normal soil for all rice genotypes Fig. 2(a-b). Under normal conditions, GZ12089-3-11-2-1 produced the longest panicles, surpassing its parents GZ6296-12-1-1-2-1-1 and Yun gen 135. Similarly, GZ12103-3-11-14-24-2 and GZ12103-3-4-6-7 exhibited the longest panicles compared to their parents, GZ9461-4-2-3-1 and GZ9399-4-1-1-3-2-2, under normal conditions. Under saline conditions, GZ12103-3-4-5-1 and GZ9461-4-2-3-1 recorded the highest values of panicle length, demonstrating their relative tolerance to salinity stress.
|
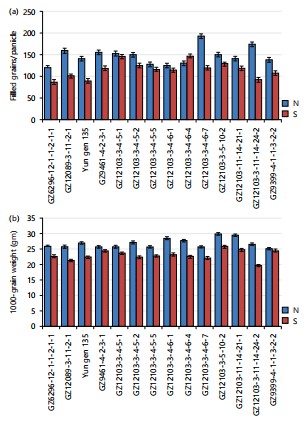
Impact of salinity stress on grain-filling and yield performance in the elite rice genotypes: For the number of filled grains per panicle, a significant reduction was observed for all rice genotypes grown under saline soil compared with the normal condition. Under normal soil location, GZ12103-3-4-6-7 and GZ12103-3-11-14-24-2 gave the highest values of number of filled grains per panicle (192.67 grains) compared to their parents GZ9461-4-2-3-1 and GZ9399-4-1-1-3-2-2, 155.67 and 139.00 grains, respectively, Fig. 3(a-b). Under saline location, the elite line GZ12089-3-11-2-1 produced more filled grains per panicle compared to its parents, GZ6296-12-1-1-2-1-1 and Yun gen 135. The GZ12103-3-4-6-4 and GZ12103-3-4-5-1 exhibited several filled grains per panicle higher than their parent, GZ9461-4-2-3-1 and GZ9399-4-1-1-3-2-2, under saline soil. In the same time, the genotype GZ12089-3-11-2-1 gave the highest values of filled grains/panicle compared to GZ6296-12-1-1-2-1-1 and Yun gen 135. The harmful effects of salinity on plant characteristics are primarily attributed to impaired growth, metabolic disruption, and a reduced ability to uptake water and nutrients22. Additionally, salt stress caused poor spikelet development, increased spikelet sterility, which significantly reduces rice grain yield23.
|
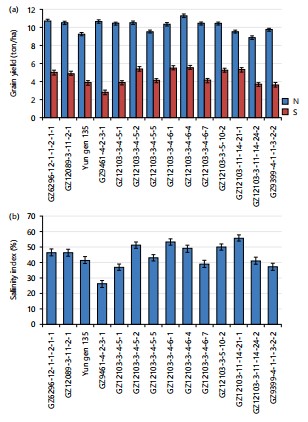
In terms of grain yield, the genotypes GZ12103-3-5-10-2 and GZ12103-11-14-21-1 produced the heaviest grains among the rice genotypes tested under normal soil at Sakha and saline soil at EL-Sriw location, Fig. 4. The grain yield was significantly reduced for all rice genotypes under saline conditions compared to normal soil. The degree of reduction varied according to the genetic background and the level of tolerance for each genotype Fig. 4(a-b). The GZ12103-3-4-6-4 achieved the highest grain yield under normal soil at Sakha, yielding 11.23 ton/ha. The genotype GZ12103-3-11-14-24-2 recorded the lowest grain yield under the same conditions. Under saline soil, GZ12103-3-4-6-4, GZ12103-3-4-6-1, and GZ12103-3-4-5-2 recorded the highest grain yield (5.53 and 5.50 ton/ha, respectively), outperforming their parents GZ9461-4-2-3-1 and GZ9399-4-1-1-3-2-2 (2.80 and 3.63 ton/ha, respectively) Fig. 4. Salt stress negatively affected the yield and its components, including spikelet’s per panicle, panicle length, number of tillers per plant, number of florets per panicle, and 1000-grain weight. Ata-Ul-Karim et al.24 reported that the number of filled grains per panicle decreased progressively as salt stress increased from 2-8 dS/m. The genotypes GZ12103-11-14-21-1, GZ12103-3-4-6-1, GZ12103-3-4-5-2, GZ12103-3-5-10-2, and GZ12103-3-4-6-4 exhibited the highest values of salinity index, indicating that these rice lines are more tolerant to salinity than their parents.
Estimates of genetic parameters: The estimates for phenotypic and genotypic variations, heritability, and genetic advance under normal and saline stress are presented in Table 4, respectively. The analysis of variance revealed a significant variation among the studied genotypes for all plant characteristics in both environments. This indicates that the selection process could be more effective across the genotypes, allowing for the improvement of traits under both conditions. These results are consistent with findings of Zavinon et al.25, who also reported high variability among genotypes under different stress conditions.
| Table 3: | Estimates of phenotypic and genotypic coefficients of variability, heritability, and genetic advance for traits of 14 rice genotypes under normal conditions (combined data of 2022 and 2023) | |||
| Trait | Grand mean |
MS.G | Error | GV | PV | GCV | PCV | h2 (%) | GA | GA (%) |
| Duration (days) | 126.26 | 10.88 | 0.73 | 3.38 | 4.11 | 1.45 | 1.6 | 82.23 | 6.96 | 5.51 |
| Plant height (cm) | 94.29 | 121.68 | 1.14 | 40.18 | 41.32 | 6.72 | 6.81 | 97.24 | 82.76 | 87.77 |
| Number of panicles/plant | 22.17 | 5.26 | 0.58 | 1.56 | 2.14 | 5.63 | 6.59 | 72.89 | 3.21 | 14.47 |
| Panicle length (cm) | 22.73 | 2.2 | 0.08 | 6.71 | 6.79 | 11.39 | 11.43 | 98.82 | 13.82 | 60.8 |
| Number of filled grains/panicle | 147.05 | 1159.68 | 14.45 | 381.74 | 396.19 | 13.28 | 13.53 | 96.35 | 786.36 | 534.75 |
| 1000-grain weight (g) | 26.84 | 6.89 | 0.217 | 2.22 | 2.26 | 5.55 | 5.6 | 98.23 | 4.56 | 16.98 |
| Grain yield (ton/ha) | 10.13 | 1.31 | 0.013 | 0.432 | 0.445 | 6.48 | 6.58 | 97.1 | 0.889 | 8.77 |
| MS.G: Mean square genotype, GV: Genotypic variance, PV: Phenotypic variance, GCV: Genotypic coefficient of variability, PCV: Phenotypic coefficient of variability, h2: Heritability in broad sense, GA: Genetic advance and GA (%): Genetic advance (%) | ||||||||||
| Table 4: | Estimates of phenotypic and genotypic coefficients of variability, heritability, and genetic advance for traits of 14 rice genotypes under saline conditions (combined data of 2022 and 2023) | |||
| Trait | Grand mean |
MS.G | Error | GV | PV | GCV | PCV | h2 (%) | GA | GA (%) |
| Duration (days) | 118.45 | 22.9 | 0.74 | 7.38 | 8.12 | 2.29 | 2.41 | 90.88 | 15.2 | 12.83 |
| Plant height (cm) | 82.61 | 80.19 | 0.51 | 26.56 | 27.07 | 6.23 | 6.29 | 98.11 | 54.71 | 66.22 |
| Number of panicles/plant | 15.36 | 6.14 | 0.24 | 1.96 | 2.2 | 9.11 | 9.65 | 89.1 | 4.03 | 26.23 |
| Panicle length (cm) | 20.5 | 3.22 | 0.64 | 0.86 | 1.5 | 4.52 | 5.97 | 57.33 | 1.77 | 8.63 |
| Number of filled grains/panicle | 111.7 | 838.82 | 89.24 | 249.86 | 339.1 | 14.15 | 16.48 | 73.68 | 514.68 | 460.77 |
| 1000-grain weight (g) | 22.98 | 7.35 | 0.042 | 2.43 | 2.47 | 6.78 | 6.83 | 98.38 | 4.98 | 21.67 |
| Grain yield (ton/ha) | 4.62 | 2.32 | 0.014 | 0.768 | 0.782 | 18.96 | 19.14 | 98.21 | 1.57 | 33.98 |
| MS.G: Mean square genotype, GV: Genotypic variance, PV: Phenotypic variance, GCV: Genotypic coefficient of variability, PCV: Phenotypic coefficient of variability, h2: Heritability in broad sense, GA: Genetic advance and GA (%): Genetic advance (%) | ||||||||||
The phenotypic coefficient of variability (PCV) was higher than the genotypic coefficient of variability (GCV) for all studied characteristics, indicating that the environmental factors affect the expression of these characters. However, the major portion of PCV (%) was contributed by the genotypic component, compared with the environmental component. The highest values for both PCV and GCV were observed in the number of filled grains per panicle under both normal and salinity stress, emphasizing the substantial genetic control over this trait Table 3.
Heritability in the broad sense (h2) was high for most of the studied traits under normal and salinity conditions, except for panicle length under saline conditions, which had a medium heritability Table 4. High heritability estimates suggest that selection based on phenotypic traits would be effective. Traits such as the number of filled grains per panicle and plant height exhibited both high heritability, coupled with high genetic advance under normal and saline oil (Table 4). This indicates that the selection process for these traits would certainly bring improvement in genotypes. The relationship between the genotypic coefficient of variability and heritability provides deeper insights into the potential for genetic gain through selection. Combining GCV with heritability estimates gives more accurate predictions about the expected genetic gain from selection26,27. In this study, traits with high GCV and heritability, such as the number of filled grains per panicle and plant height, demonstrated strong potential for improvement through selective breeding.
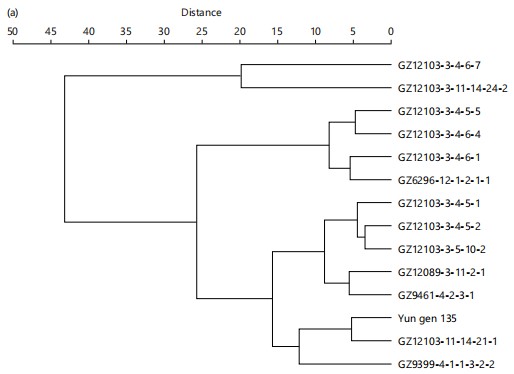
Cluster analysis of rice genotypes under normal and salinity stress conditions: Cluster analysis of the genotypes was performed under both normal and salinity stress conditions, with the results depicted in Fig. 5a (normal conditions) and Fig. 5b (salinity stress). Under normal conditions, genotypes sharing the same pedigree, particularly those derived from the GZ9461-4-2-3-1/ GZ9399-4-1-1-3-2-2 cross, exhibited similar clustering patterns, indicating that their genetic background contributes to consistent performance in non-stress environments.
|
Notably, genotypes like GZ12103-3-4-6-7, GZ12103-3-4-6-4, and GZ12103-3-4-6-1 formed a distinct cluster, reflecting their shared ancestry and stable traits under normal conditions. Additionally, genotypes such as Yun gen 135 and GZ12089-3-11-2-1, which also share lineage, clustered closely, further confirming the strong influence of pedigree on genotype performance.
|
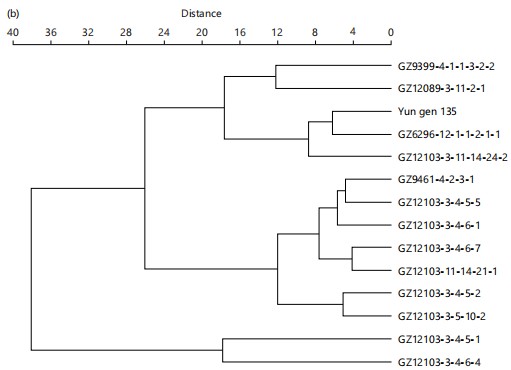
In contrast, the cluster analysis under salinity stress (Fig. 5b) revealed shifts in the grouping of certain genotypes, suggesting variation in their stress responses. The genotypes GZ12103-3-4-6-7, GZ12103-3-4-6-4, and GZ12103-3-4-6-1 remained clustered together under saline conditions, reflecting their genetic stability and potential salinity tolerance. Yun gen 135 and its derivative, GZ12089-3-11-2-1, continued to cluster closely, indicating that Yun gen 135 plays a significant role in conferring salinity resilience. Additionally, GZ9399-4-1-1-3-2-2, which formed a distinct cluster under normal conditions, showed better performance under salinity stress, highlighting its potential as a valuable source of salinity tolerance traits. These findings suggest that certain genotypes are promising candidates for breeding programs aimed at improving rice resilience in saline environments.
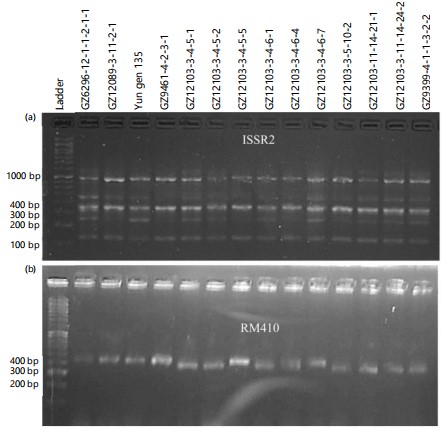
Diversity analysis via molecular markers: To have a vision regarding the existing diversity among the tested advanced lines as compared with their parents on the molecular level, different molecular markers were used. Among these markers SSR markers were more visible for indicating the differences among the tested genotypes as compared with the ISSR ones, Fig. 6. The SSR markers used were able to detect diversity among the tested genotypes; this might be due to their specificity.
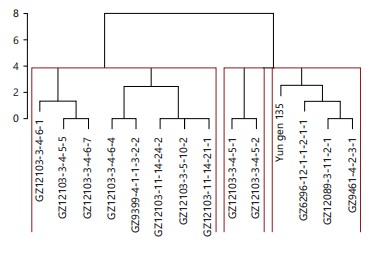
In the investigation, cluster analysis was employed to detect the diversity among the tested genotypes Fig. 6(a-b). Three main clusters were generated; the first cluster consisted of the parents’ genotypes GZ6296-12-1-1-2-1-1, Yun gen 135, and GZ9461-4-2-3-1, together with the newly developed line GZ12089-3-11-2-1. Interestingly, the parental line GZ9461-4-2-3-1 is developed from the cross Daey2Beyo/GZ6296-12-1-1-2-1-1. Having a common parent with newly developed line GZ12089-3-11-2-1, Table 1. These results are in line with those obtained by Abdelrahman et al.1, when comparing different advanced lines with the parental genotypes using SSR markers. Furthermore, the line GZ12103-3-4-5-1 was clustered with its sister line GZ12103-3-4-5-2. The GZ9399-4-1-1-3-2-2 was previously reported as salinity-tolerant genotype.
|
In this study, this genotype was clustered with genotypes GZ12103-3-4-5-2, GZ12103-3-4-5-5, and GZ12103-3-4-6-4. Those genotypes were the highest concerning yield performance under saline conditions (Fig. 7).
CONCLUSION
Current study investigation the performance several advanced rice lines under salinity stress conditions was investigated. Among those genotypes, GZ12103-3-4-5-2, GZ12103-3-4-6-1 and GZ12103-3-4-6-4 recorded the highest yield performance under salt stress conditions (5.40, 5.50 and 5.53 ton/ha, respectively). the molecular analysis revealed that those genotypes were clustered with their salinity tolerant parent GZ9399-4-1-1-3-2-2. Together these results indicate that the three selected genotypes could be advanced for yield trials and could be utilized as a high yielding pre-breeding lines in the salinity breeding program.
SIGNIFICANCE STATEMENT
This study identified three salt-tolerant rice genotypes-GZ12103-3-4-5-2, GZ12103-3-4-6-1, and GZ12103-3-4-6-4-which could be beneficial for improving rice yield under saline soil conditions. These genotypes showed superior performance under salinity stress and hold potential for use in breeding programs targeting salt-affected areas. This study will assist researchers in uncovering critical areas of salinity tolerance mechanisms and genotype performance that have remained unexplored by many. Consequently, a new theory on genotype-based resilience to abiotic stress may be developed.
REFERENCES
- Abdelrahman, M., M.E. Selim, M.A. ElSayed, M.H. Ammar and F.A. Hussein et al., 2021. Developing novel rice genotypes harboring specific QTL alleles associated with high grain yield under water shortage stress. Plants, 10.
- Bartlett, M.S., 1937. Properties of sufficiency and statistical tests. Proc. R. Soc. London, Ser. A: Math. Phys. Sci., 160: 268-282.
- Burton, G.W. and E.H. DeVane, 1953. Estimating heritability in tall fescue (Festuca arundinacea) from replicated clonal material. Agron. J., 45: 478-481.
- Burton, G.W., 1951. Quantitative inheritance in pearl millet (Pennisetum glaucum). Agron. J., 43: 409-417.
- El-Badawy, O.A., S.A. Soltan, E.M. Bleih, G.B. Anis, A.S. Taha and R.A. El-Namaky, 2024. Adaptation and selection of early maturing and high-yielding production of some exotic rice genotypes under Egyptian conditions. Environ. Biodivers. Soil Secur., 8: 1-13.
- Fageria, N.K., L.F. Stone and A.B. dos Santos, 2012. Breeding for Salinity Tolerance. In: Plant Breeding for Abiotic Stress Tolerance, Fritsche-Neto, R. and A. Borém (Eds.), Springer-Verlag, Berlin, Germany, ISBN-978-3-642-30553-5, pp: 103-122.
- Aref, F. and H.E. Rad, 2012. Physiological characterization of rice under salinity stress during vegetative and reproductive stages. Indian J. Sci. Technol., 5: 2578-2586.
- IRRI, 2013. Standard Evaluation System for Rice. 5th Edn., International Rice Research Institute, Philippine, Pages: 55.
- Johnson, H.W., H.F. Robinson and R.E. Comstock, 1955. Estimates of genetic and environmental variability in soybeans. Agron. J., 47: 314-318.
- Joseph, B., D. Jini and S. Sujatha, 2010. Biological and physiological perspectives of specificity in abiotic salt stress response from various rice plants. Asian J. Agric. Sci., 2: 99-105.
- Fukuta, Y., M.J. Telebanco-Yanoria, Y. Koide, H. Saito, N. Kobayashi, M. Obara and S. Yanagihara, 2022. Near-isogenic lines for resistance to blast disease, in the genetic background of the Indica group rice (Oryza sativa L.) cultivar IR64. Field Crop Res., 282.
- Khush, G.S., 2005. What it will take to feed 5.0 billion rice consumers in 2030. Plant Mol. Biol., 59: 1-6.
- Munns, R., R.A. James and A. Läuchli, 2006. Approaches to increasing the salt tolerance of wheat and other cereals. J. Exp. Bot., 57: 1025-1043.
- Murray, H.G. and W.F. Thompson, 1980. Rapid isolation of high molecular weight plant DNA. Nucleic Acid Res., 8: 4321-4326.
- Akhand, P., B. Prashant, L. Bapsila, Sandhya and P.K. Singh, 2018. Assessment of genetic variability for yield and yield components in rice (Oryza sativa L.) germplasms. Int. J. Bio-Resour. Stress Manage., 9: 87-92.
- Coca, L.I.R., M.T.G. González, Z.G. Unday, J.J. Hernández, M.M.R. Jáuregui and Y.F. Cancio, 2023. Effects of sodium salinity on rice (Oryza sativa L.) cultivation: A review. Sustainability, 15.
- Debsharma, S.K., M.A. Syed, M.H. Ali, S. Maniruzzaman and P.R. Roy et al ., 2023. Harnessing on genetic variability and diversity of rice (Oryza sativa L.) genotypes based on quantitative and qualitative traits for desirable crossing materials. Genes, 14.
- Anis, G.B., A.S. Taha, H.S. Abd El-Aty and T.M. Mazal, 2022. Characterization and selection of novel rice promising lines based on genetic variability, grain yield, yield components and rice stem borer susceptibility. Int. J. Entomol. Res., 7: 136-147.
- Sedeek, S.E.M., T.M. Mazal, M.A.A. Osman, A.G. Hefeina, W.H. EL-Kallawy and E.M. Bleih, 2022. Genetic diversity among some of rice genotypes under water shortage. J. Plant Prod., 13: 929-936.
- Snedecor, G.W. and W.G. Cochran, 1967. Statistical Methods. 6th Edn., Iowa State University Press, Ames, Iowa, ISBN: 9780813815602, Pages: 593.
- Shabala, S., 2013. Learning from halophytes: Physiological basis and strategies to improve abiotic stress tolerance in crops. Ann. Bot., 112: 1209-1221.
- Shannon, M.C., 1997. Adaptation of Plants to Salinity. In: Advances in Agronomy, Sparks, D. (Ed.), Academic Press, USA, ISBN: 978-0-12-000760-8, pp: 75-120.
- Karthikeyan, P., Y. Anbuselvam, R. Elangaimannan and M. Venkatesan, 2010. Variability and heritability studies in rice (Oryza sativa L.) under coastal salinity. Electron. J. Plant Breed., 1: 196-198.
- Ata-Ul-Karim, S.T., H. Begum, V. Lopena, T. Borromeo and P. Virk et al., 2022. Genotypic variation of yield-related traits in an irrigated rice breeding program for tropical Asia. Crop. Environ., 1: 173-181.
- Zavinon, F.G., R. Djossou, M. Gbéto, N. Fonhan, R. Kouke and H. Adoukonou-Sagbadja, 2024. SSR-marker assisted evaluation of genetic diversity in local and exotic pigeonpea cultivars in Benin for parental genotypes selection. Plant Gene, 37.
- Zhang, J., Y. Lin, L. Zhu, S. Yu, S.K. Kundu and Q. Jin, 2015. Effects of 1-methylcyclopropene on function of flag leaf and development of superior and inferior spikelets in rice cultivars differing in panicle types. Field Crops Res., 177: 64-74.
- Shahid, M.A., A. Sarkhosh, N. Khan, R.M. Balal and S. Ali et al., 2020. Insights into the physiological and biochemical impacts of salt stress on plant growth and development. Agronomy, 10.
How to Cite this paper?
APA-7 Style
Sedeek,
S., Osman,
M.M., Abdelrahman,
M., Abdelhamed,
M.M., Anis,
G.B. (2025). Exploring Salinity Tolerance in Advanced Rice Lines: Agronomic and Molecular Characterization for Breeding Advances. Trends in Agricultural Sciences, 4(3), 250-261. https://doi.org/10.17311/tas.2025.250.261
ACS Style
Sedeek,
S.; Osman,
M.M.; Abdelrahman,
M.; Abdelhamed,
M.M.; Anis,
G.B. Exploring Salinity Tolerance in Advanced Rice Lines: Agronomic and Molecular Characterization for Breeding Advances. Trends Agric. Sci 2025, 4, 250-261. https://doi.org/10.17311/tas.2025.250.261
AMA Style
Sedeek
S, Osman
MM, Abdelrahman
M, Abdelhamed
MM, Anis
GB. Exploring Salinity Tolerance in Advanced Rice Lines: Agronomic and Molecular Characterization for Breeding Advances. Trends in Agricultural Sciences. 2025; 4(3): 250-261. https://doi.org/10.17311/tas.2025.250.261
Chicago/Turabian Style
Sedeek, S.E.M., Mervat, M.A. Osman, M. Abdelrahman, M. M. Abdelhamed, and G. B. Anis.
2025. "Exploring Salinity Tolerance in Advanced Rice Lines: Agronomic and Molecular Characterization for Breeding Advances" Trends in Agricultural Sciences 4, no. 3: 250-261. https://doi.org/10.17311/tas.2025.250.261

This work is licensed under a Creative Commons Attribution 4.0 International License.