Evaluation and Adaptation Trial of Field Pea Varieties for the Central Ethiopia Region
-
Shimelis Mohammed

Central Ethiopia Agricultural Research Institute, Worabe Agricultural Research Centre, Worabe, Ethiopia
Mukerem EliasCentral Ethiopia Agricultural Research Institute, Worabe Agricultural Research Centre, Worabe, Ethiopia
| Received 22 Mar, 2025 |
Accepted 17 May, 2025 |
Published 30 Jun, 2025 |
Background and Objective: Field pea (Pisum sativum L.) is the most important grain legume crop grown Worldwide; it is the major legume grown in Ethiopia. The trial was conducted to evaluate adaptable and high-yielding field pea varieties for central Ethiopia. Materials and Methods: The field experiment was conducted at three locations with eight field pea varieties and a local check by using RCBD design with three replications. Data was collected for date of flowering, plant height, date of maturity, number of seeds per pod, number of seeds per plant, hundred seed weight, and grain yield. Stability analysis and GGE biplot were conducted to identify the uniformly superior and adaptable genotypes across the tested environments. Results: The mean squares of the combined analysis of varieties exhibited significant differences at (p≤0.01) and (p≤0.05) for all parameters except for the number of pods per plant. The S2di value of grain yield showed that three of the varieties significantly differed from zero, indicating the stability of these varieties across different environments. Bunitu, Welmera, and Markos, with the highest grain yield and significantly higher than average performance, had bi ≈ 1 and S2di ≈ 0, indicating the average responsiveness and stability, and thus can be considered as having general adaptability. Conclusion: Therefore, the stability analysis and GGE biplot varieties Bunitu, Welmera, and Markos were stable for the three locations and considered as having general adaptability across locations.
| Copyright © 2025 Mohammed and Elias. This is an open-access article distributed under the Creative Commons Attribution License, which permits unrestricted use, distribution, and reproduction in any medium, provided the original work is properly cited. |
INTRODUCTION
The field pea (Pisum sativum L.), a diploid species (2n = 2x = 14) within the Fabaceae family, is a significant grain legume cultivated globally. It serves as both food and animal feed and is regarded as a significant vegetable crop1. Used green mature pods as a vegetable and the dried grains used in the form of “kik”/split grains, “shiro”/milled grains of field pea, and boiled and roasted grains, i.e., un milled grains as food. Field pea is one of the major legumes grown in Ethiopia as well as in central Ethiopia. Field pea is an important forage/fodder crop in developed countries and an important source of protein (20-27% crude protein) for people in developing countries2. Field pea is a vital part of farmers’ livelihoods in the highlands of Ethiopia; it provides food and feed, as well as a useful and affordable source of protein3. The wide distribution of this crop is due to rich protein content, balanced amino acid composition, high digestibility, and comparatively higher yield levels among other pulses. It is used as a protein source for home consumption as well as for income generation of the poor farmers1. Although they are now underused, legumes may eventually play a more significant role. Increased biomass and, consequently, soil fertility are associated with improved carbon sequestration in the soil. Perhaps the best strategy for quickly increasing carbon sink capacity is to increase fertility. This can be achieved through the cultivation of legumes, which enhance nutrient availability and promote healthier soil ecosystems3. In areas where mono cropping is a dominant practice, the crop has a double advantage in terms of fixing atmospheric nitrogen, and it serves as a “Break crop” to diseases and pests when rotated with cereals4. The national average yield of field pea was low, 1.71 ton/ha5. This yield was lower than the achievable yield of 3.2 ton/ha. Under good management, field pea has a potential yield of 6.5 ton/ha6. Stability analysis based on the regression technique of Yates and Cochran7, popularized by Finlay and Wilkinson8, Eberhart and Russell9; the application of these models for explaining GEI and analyzing the performance of genotypes and test environments has been very frequent among plant breeders10,11. There was a high yield gap between the national average and the achievable yield of field pea. Evaluating varieties for potential areas and identifying the best varieties for wider and specific locations for adaptability. Therefore, this research was conducted to evaluate adaptable and high-yielding field pea varieties for the Central Ethiopian Region.
MATERIALS AND METHODS
Description of the study area: This research was carried out in three locations in Ethiopia, namely Alicho Wuriro, Mierab Azernet, and Gumer Districts, during the main cropping season in 2020. It was done by the Central Ethiopia Agricultural Research Institute, Worabe Agricultural Research Centre. Worabe Ethopia, Alicho Wuriro, Mierab Azernet, and Gumer districts were known for the production of food barley, faba bean, and field pea, annual grain crops. The soil types of trial locations were loam and clay loam, which are suitable for field pea production Table 1.
Experimental design and materials used: Eight improved field pea varieties and a local check were used. Improved varieties, namely: Adi, Bilalo, Bunitu, Burkitu, Gume, Markos, Megeri, Welmera. These experimental materials were obtained from the Kulumsa Agricultural Research Center, Ethopia. The design used for the field experiment was a Randomized Complete Block Design (RCBD) with three replications and three locations in the year of 2022 cropping season. It was done accordingly by using all field plot techniques with appropriate agronomic practices. Field pea was planted from mid-June to the end of June in the study area. Fertilizer was used as a basal application in the formulation of NPS100 kg/ha, which is grading 19N-38P2O5-0K2O+7S at planting time and hand weeding. The plot was a 3.2 m2 area containing 4 rows of 4 m long and 0.8 m wide. Using 20 cm spacing between rows and the 5 cm spacing between plants was adjusted after two weeks of germination.
Data collection: Data was collected from the plant base and plot base for yield and yield-related traits. Number of days to 50% flowering, number of days to 90% maturity, plant height, number of pods per plant, number of seeds per pod, number of seeds per plant, hundred seed weight, and grain yield.
Statistical analysis: The collected data were subjected to analysis of variance using the SAS software packages version 9.0 based on the procedures of Gomez and Gomez12. The Analysis of Variance for grain yield and yield-related traits for the three environments was conducted using a Randomized Complete Block Design. The combined analysis of variance across the environment was done to determine the differences between varieties across environments, among environments, and their interaction. Mean comparison was carried out using least significant difference (LSD) at a 5% level of significance to explain the significant differences among means of varieties and environments.
| Table 1: | Description of experimental sites | |||
| Location | Zone | Soil texture | Longitude | Latitude | Altitude (m.a.s.l) |
| Alicho-Wuriro | Siltie | Clay loam | 38°09'05" | 07°56'42" | 2787 |
| Mierab-Azernet | Siltie | Loam | 37°53'45" | 07°42'23" | 2609 |
| Gumer | Guraghe | Clay loam | 38°03'57" | 07°54'49" | 2850 |
| m.a.s.l: Meters above sea level | |||||
The combined analysis of variance across environments was done to determine differences between field pea varieties across the environment, among the environments, and also to determine their interaction effect by using the following statistical model:
where, Yij is the observed mean of the ith genotype/variety (Gi) at the jth environment (Ej),μ is the general mean, Gi, Ej, and GEij represent the effects of the genotype/variety, environment, and genotype/variety by environment interaction, respectively. The R(E) is the effect of replications within environments, and eij is the average random error associated with the ith plot that receives the ith genotype/variety in the jth environment.
Stability analysis: The method of Eberhart and Russell9 was used to calculate the regression coefficient (bi), deviation from regression (Sdi2), and coefficient of determination (Ri2). It was calculated by regressing the mean grain yield of individual genotypes/environments on the environmental/genotypic index. The phenotypic stability analysis was conducted using the model suggested by Eberhart and Russell9, where genotypes were considered fixed, while locations were random variables. The model provides two stability parameters: The first estimate was the linear regression coefficient (bi) of genotype mean on the average of all genotypes in each environment; the second estimate was the mean squares of deviation from regression (S2di) for each genotype. This method will be used in this study to characterize genotypic stability. The genotype with a value of the regression coefficient (bi~1) and a smaller deviation from the regression (Sdi2) value is thus more stable.
RESULTS AND DISCUSSION
The mean square of the combined analysis of varieties effect on the environment (genotype×environment) interaction was exhibited significantly (p≤0.05) for the date of flowering and non-significant for the rest traits (Table 2). So, it was not necessary to perform an analysis of variances for characters to separate locations. The mean squares of the combined Analysis of Varieties were highly significant (p≤0.01), different for date of maturity, plant height, and hundred seed weight. Similarly, in field pea genotypes, Researchers1,5,13-15 reported significant variations in grain yield and yield-related parameters across the tested genotypes across environments. These studies highlight the importance of selecting appropriate genotypes for specific environmental conditions to optimize agricultural productivity. Furthermore, understanding these variations can aid in breeding programs aimed at improving resilience and yield stability in field pea. The mean squares of combined analysis of varieties were significantly different at (p≤0.05) for date of flowering, number of seeds per pod, number of seeds per plant, and grain yield. The mean squares of locations exhibited significant (p≤0.05) differences for hundred seed weight and highly significant (p≤0.01) differences for number of days to flowering, number of days to date of maturity, and plant height. Whereas no significant difference for the rest traits (Table 2).
| Table 2: | Mean squares of traits for combined analysis of variance | |||
| Mean squares of traits | |||||||||
| Source of variation | df | DF | DM | PH | NPP | NSd | NSP | HSW | GY |
| Location | 2 | 188.4** | 130.9** | 778.7** | 0.01Ns | 0.64Ns | 74.12NS | 5.05* | 0.32Ns |
| Rep (location) | 6 | 32.96** | 8.46Ns | 920.08** | 0.8Ns | 0.31Ns | 90.67NS | 3.53* | 0.16Ns |
| Genotypes | 8 | 21.98* | 45.03** | 400.44** | 3.13NS | 0.59* | 220.69* | 34.74** | 0.32* |
| Location×Genotypes | 16 | 21.44* | 1.16NS | 25.74NS | 0.97NS | 0.39Ns | 87.78NS | 1.56NS | 0.06NS |
| Error | 48 | 10.21 | 8.64 | 136.18 | 1.72 | 0.34 | 90.44 | 1.35 | 0.113 |
| CV | 4.68 | 2.08 | 8.96 | 11.89 | 9.45 | 16.63 | 6.19 | 11.69 | |
| **Highly Significant at ≤0.01, *Significant at ≤0.05, and NS: Non-significant DF: Number of days at date of 50% flowering, DM: Number of days at date of 90% maturity, PH: Plant height in centimeter, NPP: Number of pods per plant, NSd: Number of seeds per pod, NSP: Number of seeds per plant, HSW: Hundred seed weight and GY: Grain yield in ton/ha | |||||||||
| Table 3: | Combined means of grain yield and yield-related traits of field pea varieties grown at three environments | |||
| Name of varietie | DF | DM | PH | NPP | NSd | NSP | HSW | GY |
| Adi | 69a-d | 142b | 125.73c | 11.56 | 5.56a | 64.33a | 19.00c | 2.82ab |
| Bilalo | 71a | 145a | 133.64a-c | 11.56 | 5.22a-d | 60.00a-c | 20.11ab | 2.92ab |
| Bunitu | 67b-d | 142b | 125.58c | 11.44 | 5.44ab | 62.67ab | 19.33bc | 2.77bc |
| Burkitu | 68a-d | 143ab | 123.09c | 10.67 | 5.22a-d | 55.89a-d | 20.44a | 3.11a |
| Gumer | 67cd | 137c | 137.36ab | 11 | 5.33a-c | 59.22a-c | 20.89a | 3.06ab |
| Local | 70a-c | 141b | 142.51a | 10.89 | 4.78d | 51.89cd | 16.00d | 2.49c |
| Markos | 70a-b | 141b | 131.29bc | 10.78 | 5.11a-d | 55.22b-d | 20.22ab | 2.81a-c |
| Megeri | 66d | 142b | 123.31c | 9.78 | 5.00b-d | 48.89d | 16.00d | 3.02ab |
| Welmera | 67b-d | 141b | 129.31bc | 11.56 | 4.89cd | 56.44a-d | 16.78d | 2.84ab |
| LSD | 3.03 | 2.79 | 11.06 | 1.24 | 0.46 | 9.01 | 1.1 | 0.32 |
| Small letters: Level of significant within treatments (similar letter indicates no significant variation among the treatments), DF: Number of days at date of 50% flowering, DM: Number of days at date of 90% maturity, PH: Plant height in centimeter, NPP: Number of pods per plant, NSd: Number of seeds per pod, NSP: Number of seeds per plant, HSW: Hundred seed weight and GY: Grain yield in ton/ha | ||||||||
| Table 4: | Estimate of stability for grain yield and hundred seed weight with respect to varieties | |||
| Varietie | GY (ton/ha) | bi | S2di | HSW(g) | bi | S2di |
| Adi | 2.82 | 0.96 | -0.004 | 19 | 0.76* | -0.443* |
| Bilalo | 2.92 | 1.65 | -0.017 | 20.11 | -0.11 | 0.508 |
| Bunitu | 2.77 | 0.76* | -0.038* | 19.33 | 1.25 | -0.372 |
| Burkitu | 3.11 | 2.87 | -0.027 | 20.44 | -1.33 | -0.15 |
| Gume | 3.06 | 1.1 | -0.036 | 20.89 | 1.83 | 0.376 |
| Local | 2.49 | -0.19 | -0.036 | 16 | 2.05 | 0.65 |
| Markos | 2.81 | 0.34* | -0.037* | 20.22 | 0.34* | -0.420* |
| Megeri | 3.02 | 1.02 | 0.043 | 16 | 2.54 | 0.023 |
| Welmera | 2.84 | 0.49* | -0.038* | 16.78 | 1.67 | -0.311 |
| bi: Regression coefficient, *Significantly different at ≤0.05 and S2di: Deviation from regression | ||||||
A significant difference was observed for the combined means of traits used under study. The highest combined mean of grain yield was recorded by Burkitu (3.11 ton/ha), followed by Gumer (3.06 ton/ha) and Megeri (3.02 ton/ha), and the least combined mean of grain yield was from the local check (2.49 ton/ha) Table 3. Gumer and Burkitu varieties were also the highest in hundred seed weight, which were 20.89 and 20.44 g, respectively. Gumer variety was the earliest from the varieties tasted in terms of maturity. It takes 137 days where whereas Bilalo variety was late in date of flowering and date of maturity; the mean average date of maturity from all tasted areas was 145 days from planting to 90% of maturity. The mean grain yield of the varieties across the testing environments ranged from 2.49-3.11 ton/ha for the local check and Burkitu, respectively. The mean hundred-seed weight of the varieties across the testing environments ranged from 16-20.89 g for the local check and Gumer, respectively (Table 4). This shows the existence of variations among varieties. Similarly, Lere et al.13 and Argaye et al.16 reported highly significant differences (p<0.001) were observed in a multi-location trial for field pea genotypes and G×E interactions. Gufi et al.17 also discussed that farmers are producing field peas under a wide range of conditions; the analysis of yields was unlikely to detect consistent differences between varieties. This variability in growing conditions can lead to fluctuations in yield performance, making it challenging to identify which varieties are truly superior. As a result, further research focusing on environmental factors may be necessary to better understand how different field pea varieties respond in diverse agricultural settings.
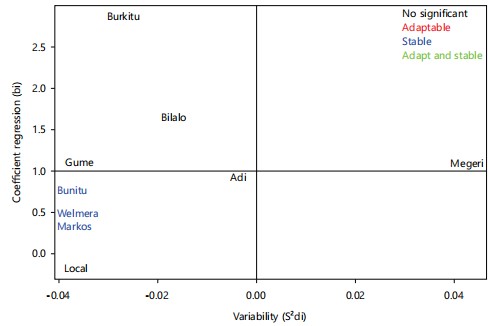
Stability: Following the method of Eberhart and Russell9 was used to calculate the regression coefficient (bi), deviation from regression (Sdi2) (Table 4 and Fig. 1). The bi ranged from -0.19 to 2.87 for the local check and Burkitu, respectively. The (S2di) value of GY showed that three of the varieties significantly differed from zero, indicating the stability of these varieties across different environments. Bunitu, Welmera, and Markos, with the highest grain yield and significantly higher than average performance, had bi ≈ 1 and S2di ≈ 0, indicating the average responsiveness and stability, and thus can be considered as having general adaptability (Fig. 1). These are desirable genotypes as their performance was uniformly superior to the tested varieties across the environments.
|
|
The bi ranged from -0.11 to 2.54 for Bilalo and Megeri, respectively. The S2di value of HSW showed that two of the varieties significantly differed from zero, indicating the stability of these varieties across different environments. The Adi and Markos with significantly higher than average performance of hundred seed weight and had bi ≈ 1 and S2di ≈ 0, indicating the average responsiveness and stability, and thus can be considered as having general adaptability.
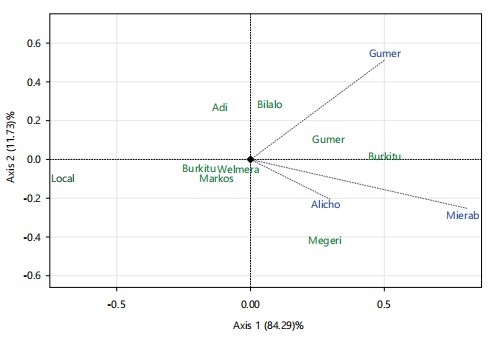
GGE Biplot: The GGE biplot analysis was used to generate graphs of the (i) Mean performance and stability analysis, (ii) Which-won-where pattern, (iii) Relationship among test locations, and (iv) Ranking discrimination and representativeness of test locations. Angles between location vectors in GGE biplot were used to judge the correlation between pairs of locations18. The GGE biplot explained 96.02% of the total variation observed, of which 84.29% was explained by the first principal component (axis 1), while the second principal component (axis 2) explained 11.73%. From the GGE biplot, varieties Bunitu, Welmera, and Markos were stable for the three locations and were approaching to mean. Varieties Gumer, Burkitu and Bilalo were best for Gumer, whereas Megeri was best for Mierab Azernet and Alicho Wuriro (Fig. 2).
CONCLUSION
The mean squares of combined analysis of field pea varieties exhibited significant differences at (p≤0.01) and (p≤0.05) for date of maturity, plant height, hundred seed weight, date of flowering, number of seeds per pod, number of seeds per plant, and grain yield. Varieties: Bunitu, Welmera, and Markos are desirable genotypes as their performance was uniformly superior to the tested varieties across the environments. Therefore, the stability analysis and GGE biplot revealed that Bunitu, Welmera, and Markos were stable for the three locations and considered as having general adaptability across the tested environments.
SIGNIFICANCE STATEMENT
A shortage of variety choices for the production and productivity of field peas is the major problem in the Central Ethiopia Region. The varieties, such as Bunitu, Welmera, and Markos, had the highest grain yield and were well adapted in the tested locations. This study was conducted to evaluate adaptable and high-yielding field pea varieties for Central Ethiopia. From this trial, varieties Bunitu, Welmera, and Markos are identified as adaptable and desirable genotypes, as their performance was uniformly superior to the tested varieties across the environments. Therefore, outreach programs should be established to educate local farmers on the benefits of these high-yielding varieties, ensuring they understand the techniques for optimal cultivation and management. By promoting these practices, we can enhance food security and agricultural productivity in the region.
ACKNOWLEDGMENT
I acknowledge the Central Ethiopia Agricultural Research Institute (CEARI), Worabe Agricultural Research Centre. I also thank Merab-Azernet, Alicho-Wuriro, and Gumer Districts Agricultural Office for providing trial fields and Kulumsa Agricultural Research Centre for providing seeds.
REFERENCES
- Gupta, A., B. Singh, M. Kumar, P. Chand, Vaishali and V.R. Sharma, 2020. Studies on genetic variability, heritability and genetic advance in table pea (Pisum sativum var. hotense L.). Int. J. Curr. Microbiol. Appl. Sci., 9: 3449-3454.
- Kapila, R.K., S. Naryal and K.C. Dhiman, 2012. Analysis of genetic diversity among garden-and field-pea genotypes of higher Indian Himalayas. J. Plant Biochem. Biotechnol., 21: 286-291.
- Yuvaraj, M., M. Pandiyan and P. Gayathri, 2020. Role of Legumes in Improving Soil Fertility Status. In: Legume Crops-Prospects, Production and Uses, Hasanuzzaman, M. (Ed.), IntechOpen, London, United Kingdom, ISBN: 978-1-83968-274-2, Pages: 182.
- Keneni, G., F. Assefa, M. Imtiaz and E. Bekele, 2013. Genetic diversity for attributes of biological nitrogen fixation in Abyssinian field pea (Pisum sativum var. Abyssinicum) germplasm accessions. Ethiopian J. Appl. Sci. Technol., 4: 1-20.
- Beyene, A.T., S. Argaye, M. Tadele, N. Tilahun and M. Jarso, 2024. Performance evaluation and stability study of field pea (Pisum sativum L.) genotypes for potential production areas in the highlands of Ethiopia. Ethiopian J. Crop Sci., 12: 1-14.
- Fikre, A., 2016. Unraveling valuable traits in Ethiopian grain legumes research hastens crop intensification and economic gains: A review. Univers. J. Agric. Res., 4: 175-182.
- Yates, F. and W.G. Cochran, 1938. The analysis of groups of experiments. J. Agric. Sci., 28: 556-580.
- Finlay, K.W. and G.N. Wilkinson, 1963. The analysis of adaptation in a plant-breeding programme. Aust. J. Agric. Res., 14: 742-754.
- Eberhart, S.A. and W.A. Russell, 1966. Stability parameters for comparing varieties. Crop Sci., 6: 36-40.
- Gauch Jr., H.G., 2006. Statistical analysis of yield trials by AMMI and GGE. Crop Sci., 46: 1488-1500.
- Yan, W., M.S. Kang, B. Ma, S. Woods and P.L. Cornelius, 2007. GGE Biplot VS AMMI analysis of genotype-by-environment data. Crop Sci., 47: 643-655.
- Gomez, K.A. and A.A. Gomez, 1984. Statistical Procedure for Agricultural Research. 2nd Edn., John Wiley and Sons, Hoboken, New Jersey, ISBN: 9780471870920, Pages: 704.
- Lere, E., S. Mohammed, M. Elias and M. Mekiso, 2022. Genotype x environment interaction and stability analysis of some selected field pea (Pisum sativum L.) varieties in Northern part of South Regional State, Ethiopia. Int. J. Biochem. Biophys. Mol. Biol., 7: 5-11.
- Kindie, Y., A. Bezabih, W. Beshir, Z. Nigusie and Z. Asemamaw et al., 2019. Field pea (Pisum sativum L.) variety development for moisture deficit areas of Eastern Amhara, Ethiopia. Adv. Agric., 2019.
- Kebede, G.Y., G.A. Haile and T. Abo, 2021. Genetic variability and associations of yield and yield related traits for fieldpea (Pisum stivum L.) genotypes in Arsi Zone, Southeastern Ethiopia. Int. J. Genet. Genomics, 9: 50-55.
- Argaye, S., M. Tadele and N. Tilahun, 2023. Agronomic performance and grain yield stability of elite field pea (Pisum sativum L.) genotypes tested at various potential growing environments in Ethiopia. Middle East Res. J. Biol. Sci., 3: 96-104.
- Gufi, Y., A. Tsegay, M.L. Ruelle, K. Teka, S. Tewolde-Berhan and A.G. Power, 2022. Field pea diversity and its contribution to farmers' livelihoods in Northern Ethiopia. Legume Sci., 4.
- Yan, W. and M.S. Kang, 2003. GGE Biplot Analysis: A Graphical Tool for Breeders, Geneticists and Agronomists. 1st Edn., CRC Press, Boca Raton, FL., USA., ISBN-9780367454791, Pages: 286.
How to Cite this paper?
APA-7 Style
Mohammed,
S., Elias,
M. (2025). Evaluation and Adaptation Trial of Field Pea Varieties for the Central Ethiopia Region. Trends in Agricultural Sciences, 4(2), 149-155. https://doi.org/10.17311/tas.2025.149.155
ACS Style
Mohammed,
S.; Elias,
M. Evaluation and Adaptation Trial of Field Pea Varieties for the Central Ethiopia Region. Trends Agric. Sci 2025, 4, 149-155. https://doi.org/10.17311/tas.2025.149.155
AMA Style
Mohammed
S, Elias
M. Evaluation and Adaptation Trial of Field Pea Varieties for the Central Ethiopia Region. Trends in Agricultural Sciences. 2025; 4(2): 149-155. https://doi.org/10.17311/tas.2025.149.155
Chicago/Turabian Style
Mohammed, Shimelis, and Mukerem Elias.
2025. "Evaluation and Adaptation Trial of Field Pea Varieties for the Central Ethiopia Region" Trends in Agricultural Sciences 4, no. 2: 149-155. https://doi.org/10.17311/tas.2025.149.155

This work is licensed under a Creative Commons Attribution 4.0 International License.