Effect of Nutrient Sources and Their Interactions on Soil Oxidation-Reduction Reaction under Field Capacity and Waterlogged Conditions
-
Dayo Olagbende Olufemi


Department of Crop Soil and Pest Management, Federal University of Technology Akure, P.M.B. 704, Akure Ondo State, Nigeria
S.A. AdejoroDepartment of Crop Soil and Pest Management, Federal University of Technology Akure, P.M.B. 704, Akure Ondo State, Nigeria
B.S. EwuloDepartment of Crop Soil and Pest Management, Federal University of Technology Akure, P.M.B. 704, Akure Ondo State, Nigeria
| Received 15 Dec, 2021 |
Accepted 23 Feb, 2022 |
Published 18 Aug, 2022 |
Background and Objective: The two major sources of nutrients to soil are organic manure and inorganic fertilizers, these nutrient sources trigger various chemical reactions in the soil that have effects on soil fertility and plant nutrition. The oxidation-reduction reaction is also known as the redox reaction is one of the reactions affected. Materials and Methods: Consequently, the focus of this research is to evaluate the effect of fertilizers from inorganic and organic sources and their combinations on the redox potentials of soil. A factorial experiment (2×2×3) was set up on two texturally differentiated soils (clay loam and sandy clay loam), the treatments were arranged in a Randomized Complete Block design (RCBD) and replicated three times. The treatment combination involved two levels of NPK 15-15-15 (0 and 200 kg ha–1), two watering regimes (field capacity and waterlogging) and three levels of poultry manure (0, 6 and 8 t ha–1) a total of twelve treatments were obtained. Redox potential was measured using a redox potential meter while hydrogen potential (pH) was measured using a pH meter. Microsoft Excel 2010 edition was used to generate graphs. Results: Results from this study revealed that organic matter is a strong electron donor, soils containing organic materials became reduced moderately while coupled with waterlogging became highly reduced. Also, the pH of the soil was found to tend towards neutral under reduced conditions. Conclusion: It was concluded that the application of organic matter to soil can trigger a reduction process, this reduction process can also move soil pH towards neutral.
| Copyright © 2022 Olufemi et al. This is an open-access article distributed under the Creative Commons Attribution License, which permits unrestricted use, distribution, and reproduction in any medium, provided the original work is properly cited. |
INTRODUCTION
Over the years, nutrients from inorganic sources have been used to improve soil fertility and plant nutrition to obtain better crop yield1. However, due to environmental problems and soil degradation problems caused by the application of this inorganic fertilizer, nutrients from organic sources have been advocated or a combination of both2. Regardless of the nutrient source employed, it has been found that soil chemical reactions are altered which in turn affects the chemical composition of the soil. Hydrogen potential (pH) is also defined more precisely as the negative of the base 10 logarithms of the activityof the hydrogen ion concentration3. Hence, soil pH is the degree of acidity or alkalinity of soil and represents the proton fluxes of the soil.
Soil pH is considered an important variable in soil science as it affects many chemical processes and in particular, it affects plant nutrient availability by controlling the chemical forms of the different nutrients and influences the chemical reactions they go through. Most plants thrive well under a pH between 6.5 and 7.5, however, many plants have adapted to thrive at pHvalues outside this range. Strong acidity or highly alkaline conditions affect plant growth, mainly because pH strongly influences nutrient availability and the risk of ion toxicity4,5.
Redox reactions are another chemical process that involves the transfer of electrons between electron donors and electron acceptors. Over time, proton flux or pH is considered as the major reaction in the soil4,6 but nowadays, the concept of electron flux or Eh is gaining attention as a type of soil chemical reaction. Oxidation-reduction reactions have been found to affect the chemistry of living organisms, that is, electron transfer, then the acid-base reactions, which focuses on proton transfers7,8. Redox potential affects microbial development, the growth of bacteria is directly correlated to changes in redox potential9 but enzymatic activities are negatively correlated with redox potential under anaerobic conditions10. Even the survivals of bacteria and fungi have been found to depend on the redox status of the soil11.
Submerged soils occupy about 72% of the total earth and are saturated with water for a sufficiently long period and as such, they develop features arising from redox processes. Soils in this state lack oxygen (anaerobic condition) which leads to a buildup of reduced compounds like Mn(II), N2, Fe(II), As(III) and S2–, when this happens, the soil is termed to be "reduced". Since oxygen is the dominant factor controlling the redox status of soil when oxygen is limited other terminal electron acceptors become important and an increase in soil organic matter can initiate reduction processes. Many fields of study dealing with organisms have used redox potential12-18.
Redox potential and pH mainly influence the form under which N is assimilated by plants as both NO3– and NH4+ are soluble in water. In-plant nutrition, the availability of P has also been found to be influenced by both soil Eh and soil pH4,19.
Despite the role of redox in soil systems, very little is known about how sources of fertilizers (inorganic and organic) affect soil redox potential, the majority focus more on pH and even the available ones are old. Hence, this research looks at the effects of poultry manure, NPK, fertilizer, watering regimes and their combinations on soil redox potential.
MATERIALS AND METHODS
Study area: The study was conducted using two soil types which are sandy clay loam and clay loam. The establishment of the first trial was done in the 2nd week of April, 2018 (rainy season) while, that of the second trial was done in the 2nd week of September, 2018 (Dry Season). The site of the experiment was at Apatapiti layout around the west gate of the Federal University of Technology, Akure (FUTA) Ondo State, Nigeria. It lies within the tropical rainforest belt in Southwestern Nigeria within latitude 5°16'N to 5°22'N and longitude 15°11'E to 15°16'E.
Experimental design and treatments combination: A factorial experiment (2×2×3) was carried out on two texturally differentiated soils (sandy clay loam and clay loam), the treatments were arranged in a Randomized Complete Block Design (RCBD) and replicated thrice. The treatment combinations involved two levels of NPK 15-15-15 (0 and 200 kg ha–1), two water regimes (field capacity and waterlogging) and three levels of poultry manure (0, 6 and 8 t ha–1). Twelve treatment combinations were obtained, giving rise to four different redox potentials which are, highly reduced soil (Eh<200), reduced soil (Eh range -130 to -100), moderately reduced soil (Eh range 200-300) and oxidized soils (Eh>300). The experiment was repeated after the termination of the first trial.
Treatment combinations:
1 |
= |
0 t ha–1 PM+0 kg ha–1 NPK+Fc |
2 |
= |
0 t ha–1 PM+0 kg ha–1 NPK+Wt |
3 |
= |
0 t ha–1 PM+200 kg ha–1 NPK+Fc |
4 |
= |
0 t ha–1 PM+200 kg ha–1 NPK+Wt |
5 |
= |
6 t ha–1 PM+0 kg ha–1 NPK+Fc |
6 |
= |
6 t ha–1 PM+0 kg ha–1 NPK+Wt |
7 |
= |
6 t ha–1 PM+200 kg ha–1 NPK+Fc |
8 |
= |
6 t ha–1 PM+200 kg ha–1 NPK+Wt |
9 |
= |
8 t ha–1 PM+0 kg ha–1 NPK+Fc |
10 |
= |
8 t ha–1 PM+0 kg ha–1 NPK+Wt |
11 |
= |
8 t ha–1 PM+200 kg ha–1 NPK+Fc |
12 |
= |
8 t ha–1 PM+200 kg ha–1 NPK+Wt |
Soil sampling and analysis: Soil samples were collected randomly from the experimental field from the 1st week after incubation (WAI) to the twelfth week after incubation (WAI) at 4 weeks interval that is 1, 4, 8 and 12 WAI. Collected samples were analyzed for hydrogen potential (pH) and redox potential (Eh). In determining for redox potential, a similar method20 was used, about 20 g of the collected soil samples was soaked in water from bottom to top to prevent entrapment of air during saturation and allowed to mix for 30 min, then 50 mL of the solution was then collected and taken to the laboratory for analysis. In the laboratory, redox potential was determined using a pH/Redox combined meter. Voltage was measured every 10 sec for 60 sec after which the mean values of the measurements were calculated. Soil pH was measured using the pH meter.
Statistical analysis: Data collected were subjected to Analysis of Variance (ANOVA) using SPSS version 17 and means were compared with Tukey’s HSD test to verify significant differences among treatments at a 5% probability level. Graphs were generated using Microsoft Excel 2010 edition.
RESULTS
Pre-experimental soil properties: Table 1 presents the pre-experimental properties of the two soils used for the experiment. Soil 1 has a sand percentage of 54.8, silt content of 20.5 and clay content of 24.7, according to the textural triangle it falls into the class of sandy clay loam. It has an Eh of 260 mv, which makes it a moderately reduced soil and a pH of 6.26 falling in the slightly acidic range. Soil 2 has a sand percentage of 48.0, silt content of 21.4 and clay content of 30.6, according to the textural triangle it falls into the class of clay loam. It has an Eh of 282 mv, which makes it moderately reduced soil and a pH of 8.25 falling in the slightly alkaline range.
Effect of treatments on soil redox potential: Table 2 and 3 present the effect of treatments applied on the soil redox potential for the first and second trials respectively from 1 week after incubation (WAI) through 12 weeks after incubation (WAI). Although there were variations in the values obtained, however, the same trend was observed throughout the trial period at both sites for the first trial. At 1 WAI, no significant (p<0.05) difference was observed among the treatments on both soils. At 4 WAI through 12 WAI, 0 t ha–1 PM+200 kg ha–1 NPK+Fcgave the highest value for soil1, 8 t ha–1 PM+200 kg ha–1 NPK+Fc gave the highest on soil 2 while, 8 t ha–1 PM+0 kg ha–1 NPK+Wt recorded the lowest for both soil 1 and soil 2 for the first trial. For the second trial, at 1 WAI, no significant (p<0.05) difference was observed among the treatments on both soils. From 4-12 WAI, 0 t ha–1 PM+200 kg ha–1 NPK+Fc recorded the highest value for soil 1 while on soil 2, 6 t ha–1 PM+0 kg ha–1 NPK+Wt recorded the highest at 4 WAI and 8 t ha–1 PM+200 kg ha–1 NPK+Fc at 8 WAI and 12 WAI. About 8 t ha–1 PM+0 kg ha–1 NPK+Wt and 8 t ha–1 PM+200 kg ha–1 NPK+Wt recorded the lowest value on both soils throughout the second trial.
| Table 1: | Pre-experimental soil analysis | |||
| Properties | Soil 1 |
Soil 2 |
| Redox potential (mv) | 260 |
282 |
| Eh Class | Moderately reduced |
Moderately reduced |
| pH (water) | 6.26 |
8.25 |
| Sand (%) | 54.8 |
48 |
| Silt (%) | 20.5 |
21.4 |
| Clay (%) | 24.7 |
30.6 |
| Textural class | Sandy clay loam |
Clay loam |
| Table 2: | Effect of treatments on soil redox potential for the first trial | |||
| PM (t ha–1) | Field capacity |
Waterlogged |
||||||
1 WAI |
4 WAI |
8 WAI |
12 WAI |
1 WAI |
4 WAI |
8 WAI |
12 WAI |
|
| Factors | ||||||||
| 0 | 271a |
316a |
313a |
300a |
273a |
-117a |
109a |
-110a |
| 6 | 271a |
210c |
211c |
201c |
272a |
-220b |
-220b |
-215b |
| 8 | 270a |
241b |
240b |
237b |
274a |
-242c |
-237c |
-236c |
| NPK (kg ha–1) | ||||||||
| 0 | 271a |
316a |
313a |
300a |
273a |
-117a |
-109a |
-110a |
| 200 | 273a |
320a |
318a |
300a |
270a |
-112a |
-110a |
-115b |
| P (F test) | ||||||||
| PM | NS |
* |
* |
* |
NS |
* |
* |
* |
| NPK | NS |
NS |
NS |
NS |
NS |
NS |
NS |
* |
| PM×NPK | NS |
* |
* |
* |
NS |
* |
* |
* |
| PM×NPK×WR | NS |
* |
* |
* |
NS |
* |
* |
* |
| Soil 2 | ||||||||
| PM (t ha-1) | ||||||||
| 0 | 260a |
272a |
320a |
305a |
263b |
-102a |
-110a |
-113a |
| 6 | 260a |
281b |
284b |
274b |
266ab |
-238b |
-240b |
-226b |
| 8 | 264a |
278b |
276c |
270b |
270a |
-246c |
-254c |
-231c |
| NPK (kg ha–1) | ||||||||
| 0 | 260a |
272a |
320a |
305a |
263a |
-102a |
-110a |
-113a |
| 200 | 261a |
256b |
308b |
302a |
266a |
-108a |
-112a |
-120b |
| P (F test) | ||||||||
| PM | NS |
* |
* |
* |
* |
* |
* |
* |
| NPK | NS |
* |
* |
NS |
NS |
NS |
NS |
* |
| PM×NPK | NS |
* |
* |
* |
* |
* |
* |
* |
| PM×NPK×WR | NS |
* |
* |
* |
* |
* |
* |
* |
| PM: Poultry manure, NPK: Nitrogen phosphorus and potassium, WR: Watering regimes, means followed by the same letters are not significantly (p>0.05) different according to Tukey’s HSD, NS: Not significant and *Significant | ||||||||
Classification of treatment based on Eh range: Table 4 presents the classification of treatments based on the redox potential range as described by Reddy, 2000. The Eh range covers from 1-12 WAI of the trial. 0 t ha–1 PM+0 kg ha–1 NPK+Fc, 0 t ha–1 PM+200 kg ha–1 NPK+Fc and 6 t ha–1 PM+0 kg ha–1 NPK+Wt have Eh ranges of 200-370, 260-430 and 280-310 respectively and they fall into the categories of oxidized soils. 6 t ha–1 PM+0 kg ha–1 NPK+Fc, 8 t ha–1 PM+0 kg ha–1 NPK+Fc and 8 t ha–1 PM+200 kg ha–1 NPK+Fc have Eh ranges of 200-290, 230-300 and 230-300, respectively and fall into the categories of moderately reduced soils. About 0 t ha–1 PM+0 kg ha–1 NPK+Wt and 0 t ha–1 PM+200 kg ha–1 NPK+Wt fall into the class of reduced soils having Eh ranges of -120 to -100 and -130 to -100, respectively. About 6 t ha–1 PM+0 kg ha–1 NPK+Wt, 6 t ha–1 PM+200 kg ha–1 NPK+Wt, 8 t ha–1 PM+0 kg ha–1 NPK+Wt and 8 t ha–1 PM+200 kg ha–1 NPK+Wt all fall into the highly reduced categories having Eh ranges of -240 to -210, -230 to -200, -240 to -230 and -240 to -230, respectively.
Relationship between redox potential (Eh) and hydrogen potential (pH): Figure 1a and b present the relationship between redox potential (Eh) and hydrogen potential (pH) in soil 1 and 2, respectively. The graph was generated using a combination of results from soil 1 (acidic) and soil 2 (alkaline). The figures if combined show something similar to a V-shaped graph with Eh on the vertical or Y-axis and pH on the horizontal or X-axis.
| Table 3: | Effect of treatments on soil redox potential for the second trial | |||
| PM (t ha–1) | Field capacity |
Waterlogged |
||||||
1 WAI |
4 WAI |
8 WAI |
12 WAI |
1 WAI |
4 WAI |
8 WAI |
12 WAI |
|
| Factors | ||||||||
| 0 | 371a |
358a |
305a |
300a |
373a |
-110a |
-106a |
-110a |
| 6 | 371a |
308b |
209c |
283a |
373a |
-226b |
-220b |
-238c |
| 8 | 370a |
356a |
252b |
232b |
377a |
-248c |
-240c |
-231b |
| NPK (kg ha–1) | ||||||||
| 0 | 371a |
358b |
305b |
300a |
373a |
-110a |
-106a |
-110a |
| 200 | 371a |
424a |
319a |
300a |
373a |
-110a |
-107a |
-114a |
| P (F test) | ||||||||
| PM | NS |
* |
* |
* |
NS |
* |
* |
* |
| NPK | NS |
* |
* |
NS |
NS |
NS |
NS |
NS |
| PM×NPK | NS |
* |
* |
* |
NS |
* |
* |
* |
| PM×NPK×WR | NS |
* |
* |
* |
NS |
* |
* |
* |
| Soil 2 | ||||||||
| PM (t ha–1) | ||||||||
| 0 | 344a |
302c |
304a |
305a |
345a |
-108a |
-110a |
-111a |
| 6 | 345a |
308b |
283b |
290b |
348a |
-226b |
-238b |
-224b |
| 8 | 345a |
356a |
275c |
291b |
350a |
-248c |
-246c |
-233c |
| NPK (kg ha–1) | ||||||||
| 0 | 344a |
212b |
214b |
205b |
345a |
-108a |
-110a |
-111a |
| 200 | 344a |
301a |
305a |
300a |
346a |
-108a |
-114a |
-124b |
| P(F test) | ||||||||
| PM | NS |
* |
* |
* |
* |
* |
* |
* |
| NPK | NS |
* |
* |
* |
NS |
NS |
NS |
* |
| PM×NPK | NS |
* |
* |
* |
* |
* |
* |
* |
| PM×NPK×WR | NS |
* |
* |
* |
* |
* |
* |
* |
| PM: Poultry manure, NPK: Nitrogen phosphorus and potassium, WR: Watering regimes, means followed by the same letters are not significantly (p>0.05) different according to Tukey’s HSD, NS: Not Significant and *Significant | ||||||||
| Table 4: | Classification of treatment based on Eh range | |||
| Treatments | Treatment descriptions |
Eh range |
Eh class |
| 1 | 0 t ha–1 PM+0 kg ha–1 NPK +FC |
>300 |
Oxidized |
| 2 | 0 t ha–1 PM+0 kg ha–1 NPK+WL |
-120 to -100 |
Reduced |
| 3 | 0 t ha–1 PM+200 kg ha–1 NPK+FC |
>300 |
Oxidized |
| 4 | 0 t ha–1 PM+200 kg ha–1 NPK+WL |
-130 to -100 |
Reduced |
| 5 | 6 t ha–1 PM+0 kg ha–1 NPK+FC |
100 to 300 |
Moderately reduced |
| 6 | 6 t ha–1 PM+0 kg ha–1 NPK+WL |
-240 to -210 |
Highly reduced |
| 7 | 6 t ha–1 PM+200 kg ha–1 NPK+FC |
>300 |
Oxidized |
| 8 | 6 t ha–1 PM +200 kg ha–1 NPK+WL |
-230 to -200 |
Highly reduced |
| 9 | 8 t ha–1 PM+0 kg ha–1 NPK+FC |
100 to 300 |
Moderately reduced |
| 10 | 8 t ha–1 PM+0 kg ha–1 NPK+WL |
-240 to -230 |
Highly reduced |
| 11 | 8 t ha–1 PM+200 kg ha–1 NPK+FC |
100 to 300 |
Moderately reduced |
| 12 | 8 t ha–1 PM+200 kg ha–1 NPK+WL |
-240 to -230 |
Highly reduced |
| PM: Poultry manure, NPK: Nitrogen phosphorus and potassium, 15-15-15, WL: Waterlogged and FC: Field capacity | |||
The horizontal line is also the dividing line between the oxidized treatments (at the upper part of the graph) and the reduced treatments (at the lower part of the graph). On the X-axis also, below value 7 indicates a state of acidity while above 7 indicates alkalinity. Eh and their corresponding pH values on the acidic side are, 302 mv:5.90, 285 mv:5.98, 249 mv:6.00, 236 mv.6.02, 231 mv.6.02, 206 mv.6.08, -111 mv:6.12, -114 mv:6.22, -205 mv:6.58, -216 mv.6.79,-231 mv.6.81, -237 mv.6.86. On the alkaline side, 300 mv:8.21, 299 mv:8.18, 293 mv:8.17, 291 mv:8.15, 230 mv:8.10, 223 mv:8.11, 206 mv:8.10, -112 mv:7.40, -121 mv:7.30, -221 mv:7.21, -225 mv:7.21, -231 mv:7.10. The graph shows that a slight change in redox potential under oxidized conditions leads to a slight change in pH but a slight change in redox potential under reduced conditions leads to a huge change in pH. It also shows that when soils are subjected to oxidation processes, pH tends toward extremities but when soils are subjected to reduction processes, pH tends towards neutral.
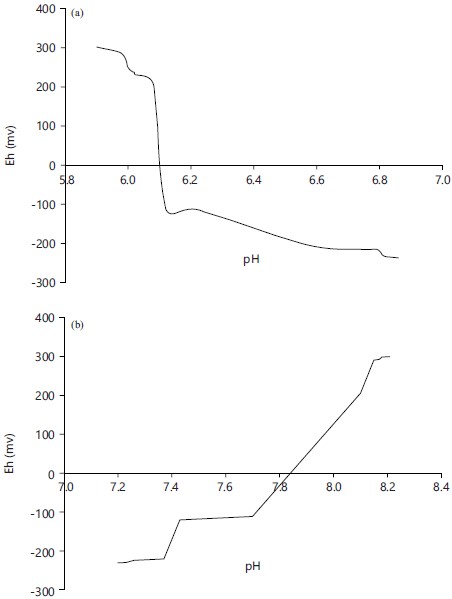 Fig. 1(a-b): Relationship between redox potential (Eh) and pH (a) Soil 1 and (b) Soil 2 |
DISCUSSION
Redox potential is an often overlooked reaction in soil science, however, it is as important as the acid-base reaction that is mostly used in basic soil analysis. It describes the oxidation or reduction status of the soil and it is a kind of reaction involving the change of oxidation state of a system through the transfer of an electron from a donor (which is the reducing agent) to an electron acceptor (oxidizing agent). Results from this research showed that the treatment applied had a significant (p<0.5) influence on the redox status of the soil. Application of organic matter at various levels showed a reduction over the trial period which took effect at 4 weeks after incubation (WAI) to 12 weeks after incubation (WAI) (Table 2 and 3). According to basic chemistry, three factors are needed to trigger oxidation or reduction in a system which is, (1) The presence or absence of an electron donor, (2) Electron shuttles and (3) The Presence of an electron acceptor. Organic matter has been reported to be a good source of energy for microbes21 and a strong electron donor22 and as such has the potency to initiate the reduction process. From the result, soils treated with only organic matter of poultry sources were moderately reduced, apparently because of the transfer of an electron from the organic matter. Waterlogging is also a major factor for reduction processes in soil. It hinders the movement of air and oxygen which is the strongest oxidizing agent into the soil, this phenomenon23 gives rise to the development of facultative anaerobic microorganisms and eventually obligate anaerobic microorganisms. These organisms24 are electron shuttles that transfer electrons from a donor to an acceptor and in the process utilizing the energy given off for respiration. Also, in this study treatments that were subjected to waterlogging alone were reduced while, those subjected to both organic matters and waterlogging became highly reduced. This is obviously because the factors that trigger reduction processes are available and the soil components serve as electron acceptors. This agrees with the research of Ali et al.25, who observed a sharp decline in the redox potential of rice fields after flooding. Soils that were subjected to Field capacity without organic matter fell into the oxidized categories, this is because of the free influx and outflux of oxygen and low amount of electron donors in the system.
The acid-base reaction also known as hydrogen potential or pH is a major reaction used in soil analysis26. From the results obtained in this research, redox potential has a significant (p<0.05) influence on soil pH. However, redox potential under acidic conditions is inversely proportional to pH but directly proportional to pH under alkaline conditions as shown in Fig. 1a and b. Oxidation processes tend pH towards extremes while reduction processes tend pH towards neutral. Nitrification is an oxidation process, it involves the conversion or oxidation of ammonia (NH4) to nitrite (NO2) which is carried out by Nitrosomonas and further conversion of nitrite to nitrate (NO3) carried out by Nitrobacter. The first step of nitrification leads to the formation of four molecules of hydrogen ion:
The hydrogen ion is acid-forming, consequently, the soil becomes more acidic. Decomposition is another oxidation process and it has been found to retain and hold onto cations making its cation holding capacity high as well as a high liming effect27. Excess of cation in soils particularly clay soil can cause alkalinity. When a free electron is present in a vacuum, a proton may pick it up and become a free radical or neutral as illustrated in the equation below:
Also, this study by Bohrerova et al.28 found out that the reduction process tends to consume hydrogen ion which is an acid-forming ion stating that soil pH is negatively correlated to redox potential. This could be responsible for the increase of pH in acidic soils and decrease in pH in alkaline soils:
CONCLUSION
The objective of this research was to evaluate the effect of soil additives on the redox status of the soil. The results affirm the potency of organic matter as a strong electron donor that can trigger reduced conditions in soil components. The level of reduction is more pronounced when organic matter application is combined with waterlogging. Soil pH was greatly altered, reduction process tends pH towards neutral while oxidation process tends pH towards acidity or alkalinity.
SIGNIFICANCE STATEMENT
This study discovered the potency of organic matter to trigger reduction processes in soil that can be beneficial to soil scientists and agronomists, this study will help researchers to uncover the critical areas of soil chemistry, conservation and management that many researchers were not able to explore. Thus a new theory on soil reaction may be arrived at.
REFERENCES
- Zhang, H., B. Wang and M. Xu, 2008. Effects of inorganic fertilizer inputs on grain yields and soil properties in a long-term wheat-corn cropping system in South China. Commun. Soil Sci. Plant Anal., 39: 1583-1599.
- Dayo-Olagbende, G.O., B.S. Ewulo and O.O. Akingbola, 2019. Combined effects of tithonia mulch and urea fertilizer on soil physico-chemical properties and maize performance. J. Sustainable Technol., Vol. 10, No. 1 86-93.
- Slessarev, E.W., Y. Lin, N.L. Bingham, J.E. Johnson, Y. Dai, J.P. Schimel and O.A. Chadwick, 2016. Water balance creates a threshold in soil pH at the global scale. Nature, 540: 567-569.
- Weil, R.R. and N.C. Brady, 2016. The Nature and Properties of Soils. 15th Edn., Pearson Education Ltd., London, England, ISBN: 9781292162249, Pages: 1104.
- Marschner, P., 2012. Marschner's Mineral Nutrition of Higher Plants. 3rd Edn., Academic Press Ltd., London, UK, ISBN: 978-0-12-384905-2, Pages: 889.
- ŠImek, M. and J.E. Cooper, 2002. The influence of soil pH on denitrification: Progress towards the understanding of this interaction over the last 50 years. Eur. J. Soil Sci., 53: 345-354.
- Dietz, K.J., 2003. Redox control, redox signaling, and redox homeostasis in plant cells. Int. Rev. Cytol., 228: 141-193.
- Falkowski, P.G., T. Fenchel and E.F. Delong, 2008. The microbial engines that drive earth's biogeochemical cycles. Science, 320: 1034-1039.
- Kimbrough, D.E., Y. Kouame, P. Moheban and S. Springthorpe, 2006. The effect of electrolysis and oxidation-reduction potential on microbial survival, growth, and disinfection. Int. J. Environ. Pollut., 27: 211-221.
- Małgorzata, B., 2004. Aeration Status of Soil and Enzyme Activity. In: Soil Plant Atmosphere Aeration and Environment Problems. Glinski, J., G. Josefaciuk, K. Stahr, (Eds.), Hohenhein University, Germany, pp: 55-59.
- Dayo-Olagbende, G.O., S.A. Adejoro, B.S. Ewulo and M.A. Awodun, 2019. Effects of oxidation-reduction potentials on soil microbes. Agricultura, 16: 35-42.
- Guérin, B., 2004. Bioénergétique. 1st Edn., EDP Sciences, France, ISBN: 9782868837400, Pages: 276.
- Chadwick, O.A. and J. Chorover, 2001. The chemistry of pedogenic thresholds. Geoderma, 100: 321-353.
- Lambers, H., F.S. Chapin and T.L. Pons, 2008. Plant Physiological Ecology. 2nd Edn., Springer-Verlag, New York, USA., ISBN-13: 9780387783413, Pages: 605.
- de Gara, L., V. Locato, S. Dipierro and M.C. de Pinto, 2010. Redox homeostasis in plants. The challenge of living with endogenous oxygen production. Respir. Physiol. Neurobiol., 173: S13-S19.
- Reddy, K.R. and R.D. DeLaune, 2008. Biogeochemistry of Wetland Science and Applications.
1st Edn., CRC Press, Boca Raton, Florida, ISBN: 9780429095764, Pages: 800.
- Foyer, C.H. and G. Noctor, 2003. Redox sensing and signalling associated with reactive oxygen in chloroplasts, peroxisomes and mitochondria. Physiol. Plant., 119: 355-364.
- Dessaux, Y., P. Hinsinger and P. Lemanceau, 2009. Rhizosphere: So many achievements and even more challenges. Plant Soil, 321: 1-3.
- Kemmou, S., J.E. Dafir, M. Wartiti and M. Taoufik, 2006. Seasonal variations and potential mobility of sediment phosphorus in the Al Massira Reservoir, Morocco. Water Qual. Res. J., 41: 427-436.
- Rabenhorst, M.C., W.D. Hively and B.R. James, 2009. Measurements of soil redox potential. Soil Sci. Soc. Am. J., 73: 668-674.
- Pezeshki, S.R. and R.D. DeLaune, 2012. Soil oxidation-reduction in wetlands and its impact on plant functioning. Biology, 1: 196-221.
- Tokarz, E. and D. Urban, 2015. Soil redox potential and its impact on microorganisms and plants of wetlands. J. Ecol. Eng., 16: 20-30.
- Ahmed, F., M.Y. Rafii, M.R. Ismail, A.S. Juraimi, H.A. Rahim, R. Asfaliza and M.A. Latif, 2013. Waterlogging tolerance of crops: Breeding, mechanism of tolerance, molecular approaches, and future prospects. BioMed Res. Int.
- Conley, B.E., P.J. Intile, D.R. Bond and J.A. Gralnick, 2018. Divergent Nrf family proteins and MtrCAB homologs facilitate extracellular electron transfer in Aeromonas hydrophila. Appl. Environ. Microbiol.
- Ali, M.A., J.H. Oh and P.J. Kim, 2008. Evaluation of silicate iron slag amendment on reducing methane emission from flood water rice farming. Agric. Ecosyst. Environ., 128: 21-26.
- Gentili, R., R. Ambrosini, C. Montagnani, S. Caronni and S. Citterio, 2018. Effect of soil pH on the growth, reproductive investment and pollen allergenicity of Ambrosia artemisiifolia L. Front. Plant Sci.
- Magdoff, F. and H. van Es, 2021. What Is Organic Matter and Why Is It So Important. In: Building Soils for Better Crops: Ecological Management for Healthy Soils, Magdoff, F. and H. van Es (Eds.), Sustainable Agriculture Research and Education, US, ISBN: 9781888626193, pp: 3-49.
- Bohrerova, Z., R. Stralkova, J. Podesvova, G. Bohrer and E. Pokorny, 2004. The relationship between redox potential and nitrification under different sequences of crop rotations. Soil Tillage Res., 77: 25-33.
How to Cite this paper?
APA-7 Style
Olufemi,
D.O., Adejoro,
S., Ewulo,
B. (2022). Effect of Nutrient Sources and Their Interactions on Soil Oxidation-Reduction Reaction under Field Capacity and Waterlogged Conditions
. Trends in Agricultural Sciences, 1(1), 19-27. https://doi.org/10.17311/tas.2022.19.27
ACS Style
Olufemi,
D.O.; Adejoro,
S.; Ewulo,
B. Effect of Nutrient Sources and Their Interactions on Soil Oxidation-Reduction Reaction under Field Capacity and Waterlogged Conditions
. Trends Agric. Sci 2022, 1, 19-27. https://doi.org/10.17311/tas.2022.19.27
AMA Style
Olufemi
DO, Adejoro
S, Ewulo
B. Effect of Nutrient Sources and Their Interactions on Soil Oxidation-Reduction Reaction under Field Capacity and Waterlogged Conditions
. Trends in Agricultural Sciences. 2022; 1(1): 19-27. https://doi.org/10.17311/tas.2022.19.27
Chicago/Turabian Style
Olufemi, Dayo, Olagbende, S.A. Adejoro, and B.S. Ewulo.
2022. "Effect of Nutrient Sources and Their Interactions on Soil Oxidation-Reduction Reaction under Field Capacity and Waterlogged Conditions
" Trends in Agricultural Sciences 1, no. 1: 19-27. https://doi.org/10.17311/tas.2022.19.27

This work is licensed under a Creative Commons Attribution 4.0 International License.